Forensic Analysis: Multiple Scientific Proofs of Insertion Fraud in Jonas Images
The Verdict: Jonas Images Are Scientifically Proven Fakes
Real camera raw files (like CR2) capture light data in a smooth, natural spread of values (0–16383 for 14-bit). Genuine photos never have big "dead zones" (gaps with zero pixels) or weird spikes.
Jonas images show exactly that, entire 19 images show large dead zone, unnatural gaps and peaks—suggesting they're inserted synthetic images into an hollowed out CR2 container from a donor, not straight from a camera sensor. It's like a fingerprint of digital tampering. Not the image but the noise of the sensors tell the story of authenticity.
histograms for IMG_1853, 1854, and 1855.CR2. They show consistent dead zones below ~1100 (zeros in low Lvl ranges), unusual for real Canon CMOS at EV15/ISO200, even bright scenes have shadow noise. WB boosts shift curves but don't erase lows like this. Suggests possible synthesis
The red histogram (Jonas fake) shows an unnaturally smooth curve with a sharp cutoff and zero pixel counts in the audited black level ranges (1023–1280), indicating a lack of sensor noise typical in real camera RAW files. Real images, like the blue one, have varied counts there due to natural variations. This suggests the Jonas image is synthetic or manipulated.
Simple 14 Bit histogram check exposes Jonas Fake CR2s. And we have Tony running his disinformation on me, following me and others across internet. Wrongly associating me with other aliases just to run his disinfo.
Real image histograms (Blue)
Camera sensors dont see image, they see photons. Photons are noisy boundy energy that when hits the sensor, generates electrical charges at each pixel. This charge is then turned into 14 Bit Luminosity values. At the time of viewing the image, the image is generated based on which color the pixel is associated with. On a high level this is what the camera does.
on a 14 bit sensor like Canon 5D mark II, the light can sit at 14 bit values that's 16,384 values. Regardless of the environment, as long as there's some light, there will be a large variation in light that's captured, image is formed based on that light intensity variations.
Think of image formation like a wooden sculpture.
- The Signal: The carved shape of the wood (the image you see).
- The Noise: The natural grain of the wood.
This is why you see a wide distribution even if it's just a sky or an ocean, the light diffusion ensures sensor is range is well utilized
in a DSLR the image has
- Sensor charge noise or Shot noise
- Temperature noise, which scaled with Sensor temperature. It's gets very noisy at around 30 degrees.
- Real world photon scattering noise.
Thermal and Shot noise create a distinct 'noise floor' visible at the far left of the histogram (the shadows). In a real physical sensor, silence is impossible; there is always energy. Therefore, the absence of this noise proves the data is either from a broken sensor or is a fraud.
This is the critical forensic failure: scammers injected 'clean' digital images into the CR2 file, forgetting that real hardware always writes "sensor noise" and image "signal & noise". Image signal has noth Image and real world noise.
A RAW is a collection of (simplified)
- CMOS sensor noise (Thermal, Shot, Read noise)
- Image photon signal. This signal has noth image and real world noise.
Jonas image has scrubbed CMOS Sensor Noise (the Dead zone), The image is not generated by real world Photons, instead by Photoshop. It has no Real world photon distribution (All Real world checks FAIL)
The blue histogram left side shows how the physical sensor noise—temperature and shot noise are blended in with real world noise.
In real CMOS sensors, histograms of dark frames show Gaussian spread from read noise (typically 2–10 e- RMS) and thermal dark current (doubles every ~6–8°C, significant at 22°C for exposures >1s, adding Poisson noise). This histogram's sharp low-end cutoff and gaps (e.g., zeros in listed levels) lack expected noise tails, suggesting possible synthetic origin or heavy processing. Not impossible if cooled/short exposure, but atypical. Share RAW for code sim?
![14-Bit Linear Audit: lmaging res400.CR2 [REAL] - Blue histogram showing normal sensor noise distribution](images/img-000.png)
| Sensor Range | Pixel Count |
|---|---|
| Lvl 1023-1024 | 0 |
| Lvl 1025-1056 | 8805 |
| Lvl 1057-1088 | 86455 |
| Lvl 1089-1120 | 87140 |
| Lvl 1121-1152 | 110718 |
| Lvl 1153-1184 | 125965 |
| Lvl 1185-1216 | 113768 |
| Lvl 1217-1248 | 90352 |
| Lvl 1249-1280 | 85319 |
![14-Bit Linear Audit: canon_eos_5d_mark_ii_01.cr2 [REAL] - Blue histogram showing normal sensor noise distribution](images/img-001.png)
| Sensor Range | Pixel Count |
|---|---|
| Lvl 1023-1024 | 695 |
| Lvl 1025-1056 | 522578 |
| Lvl 1057-1088 | 706171 |
| Lvl 1089-1120 | 645804 |
| Lvl 1121-1152 | 716207 |
| Lvl 1153-1184 | 601178 |
| Lvl 1185-1216 | 392654 |
| Lvl 1217-1248 | 214787 |
| Lvl 1249-1280 | 122183 |
Baseline Research: Establishing Authentic Sensor Behavior
Objective
Establish that CMOS sensor noise characteristics are inherent to the hardware and independent of scene content.
Methodology
We captured images of featureless sky using a Canon 5D Mark II to simulate worst-case conditions for histogram variance. A uniform, low-contrast subject like open sky minimizes scene-driven tonal variation, isolating the sensor's intrinsic noise behavior.
Understanding Optical Black (OB) Pixels
What They Are: Optical Black pixels are physically masked photosites located at the periphery of the CMOS sensor die. Covered by an opaque metal shield, these pixels receive no photons and measure the sensor's baseline signal in complete darkness.
Physical Placement: On Canon sensors, OB pixels occupy rows and columns along the sensor edges—outside the active image area.
Calibration Function: OB pixels calibrate for:
- Dark Current — Thermally generated electrons accumulating independent of light exposure
- Read Noise — Electronic noise from analog-to-digital conversion and pixel readout circuitry
- Fixed Pattern Noise (FPN) — Manufacturing-induced pixel-to-pixel variations
- Bias/Offset Voltage — Baseline DC offset applied before digitization
Reference Level: The camera firmware calculates the mean OB value (approximately 1024 in 14-bit Canon RAW) as the "zero light" reference point.
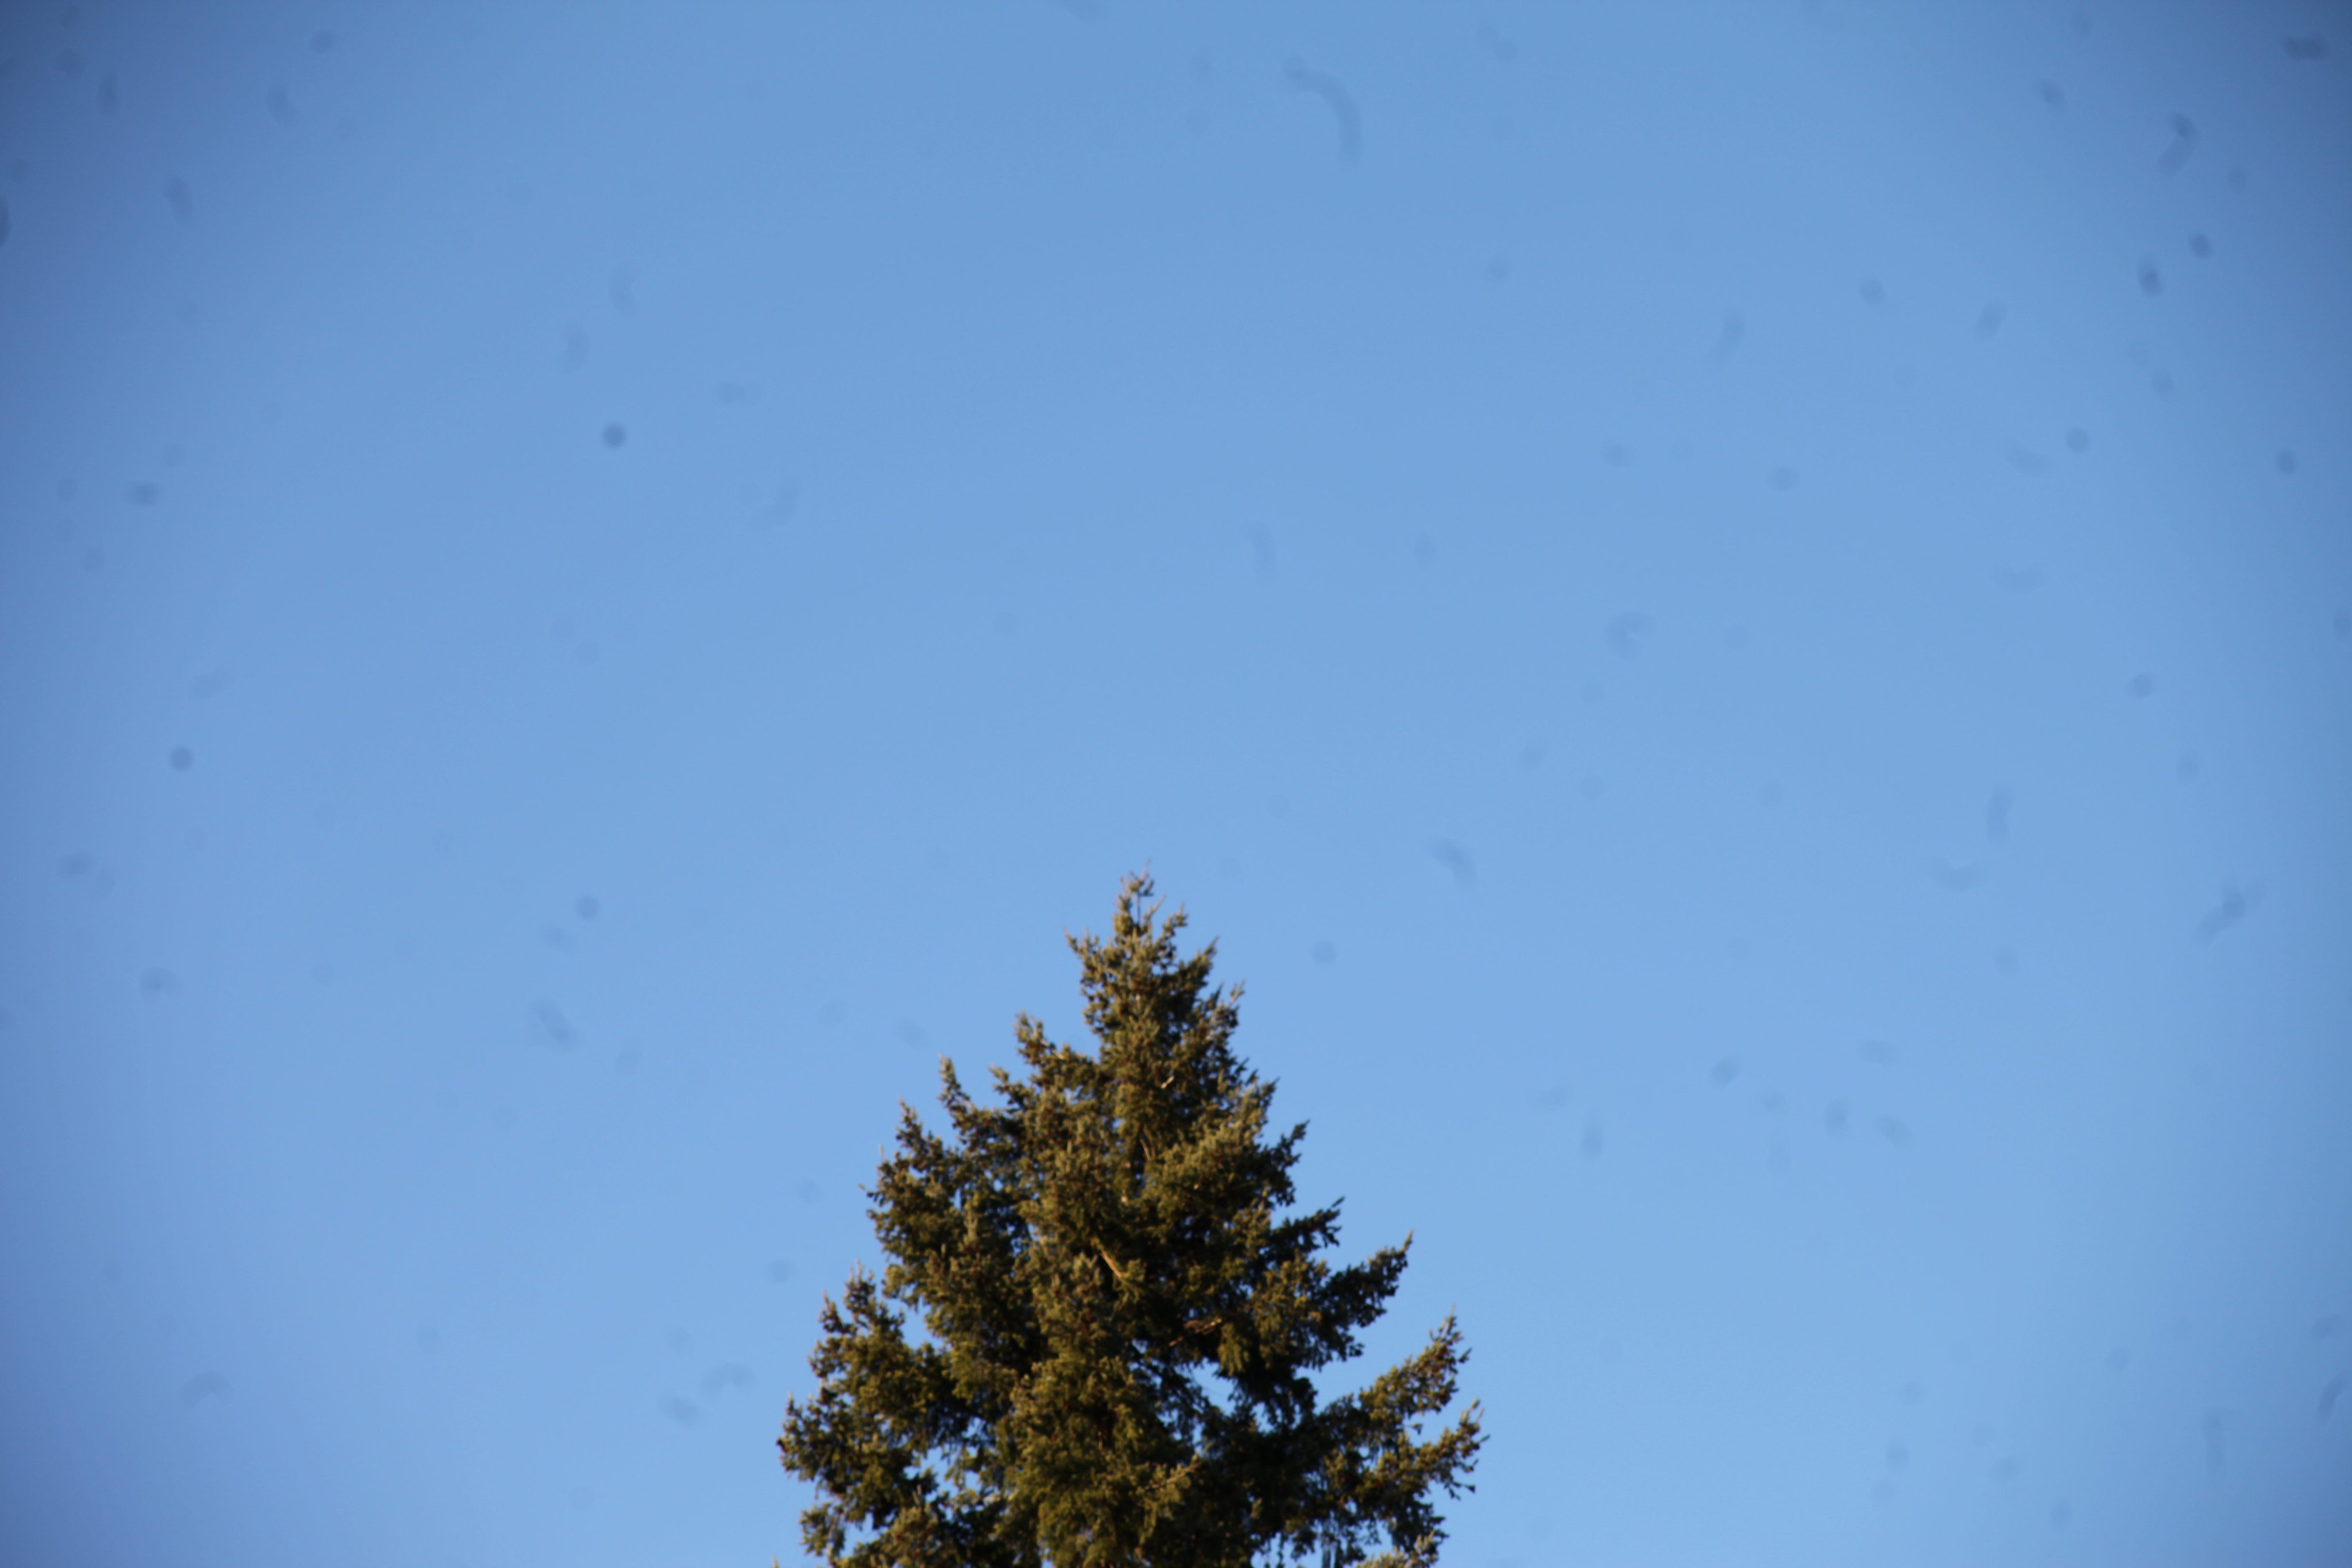
Baseline Set 1: IMG_3564.CR2
Plain sky with tree reference — Canon 5D Mark II
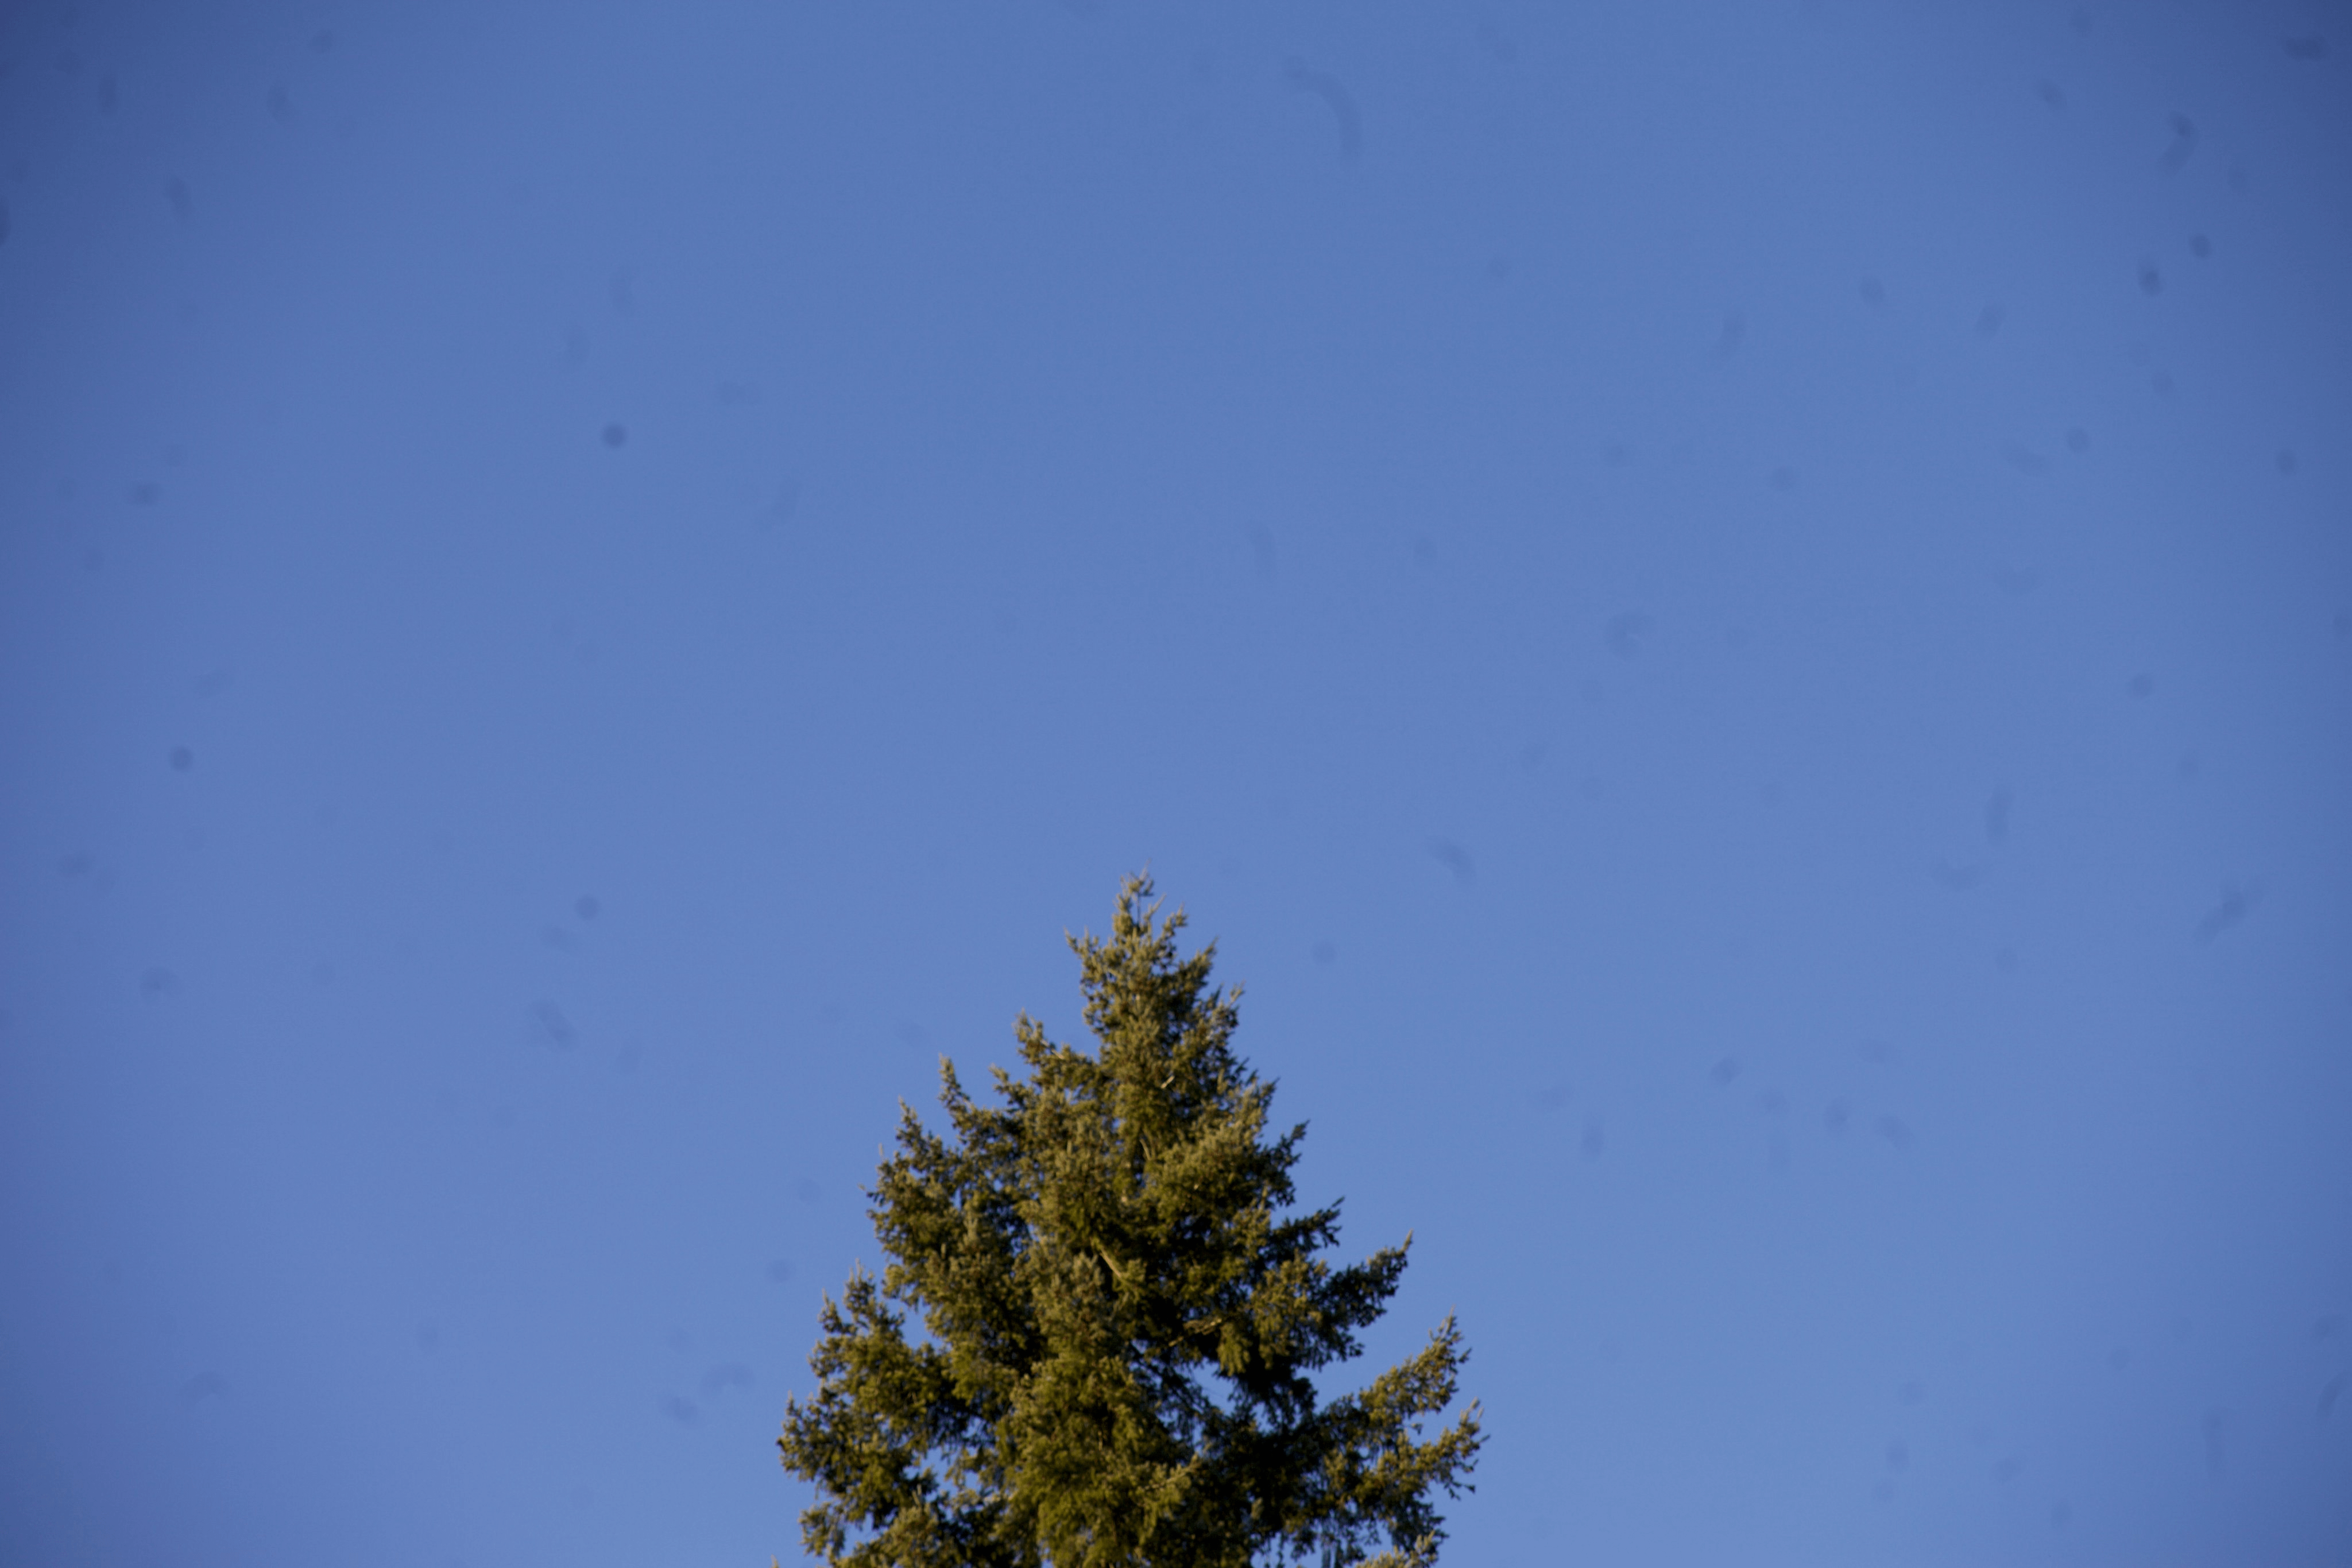
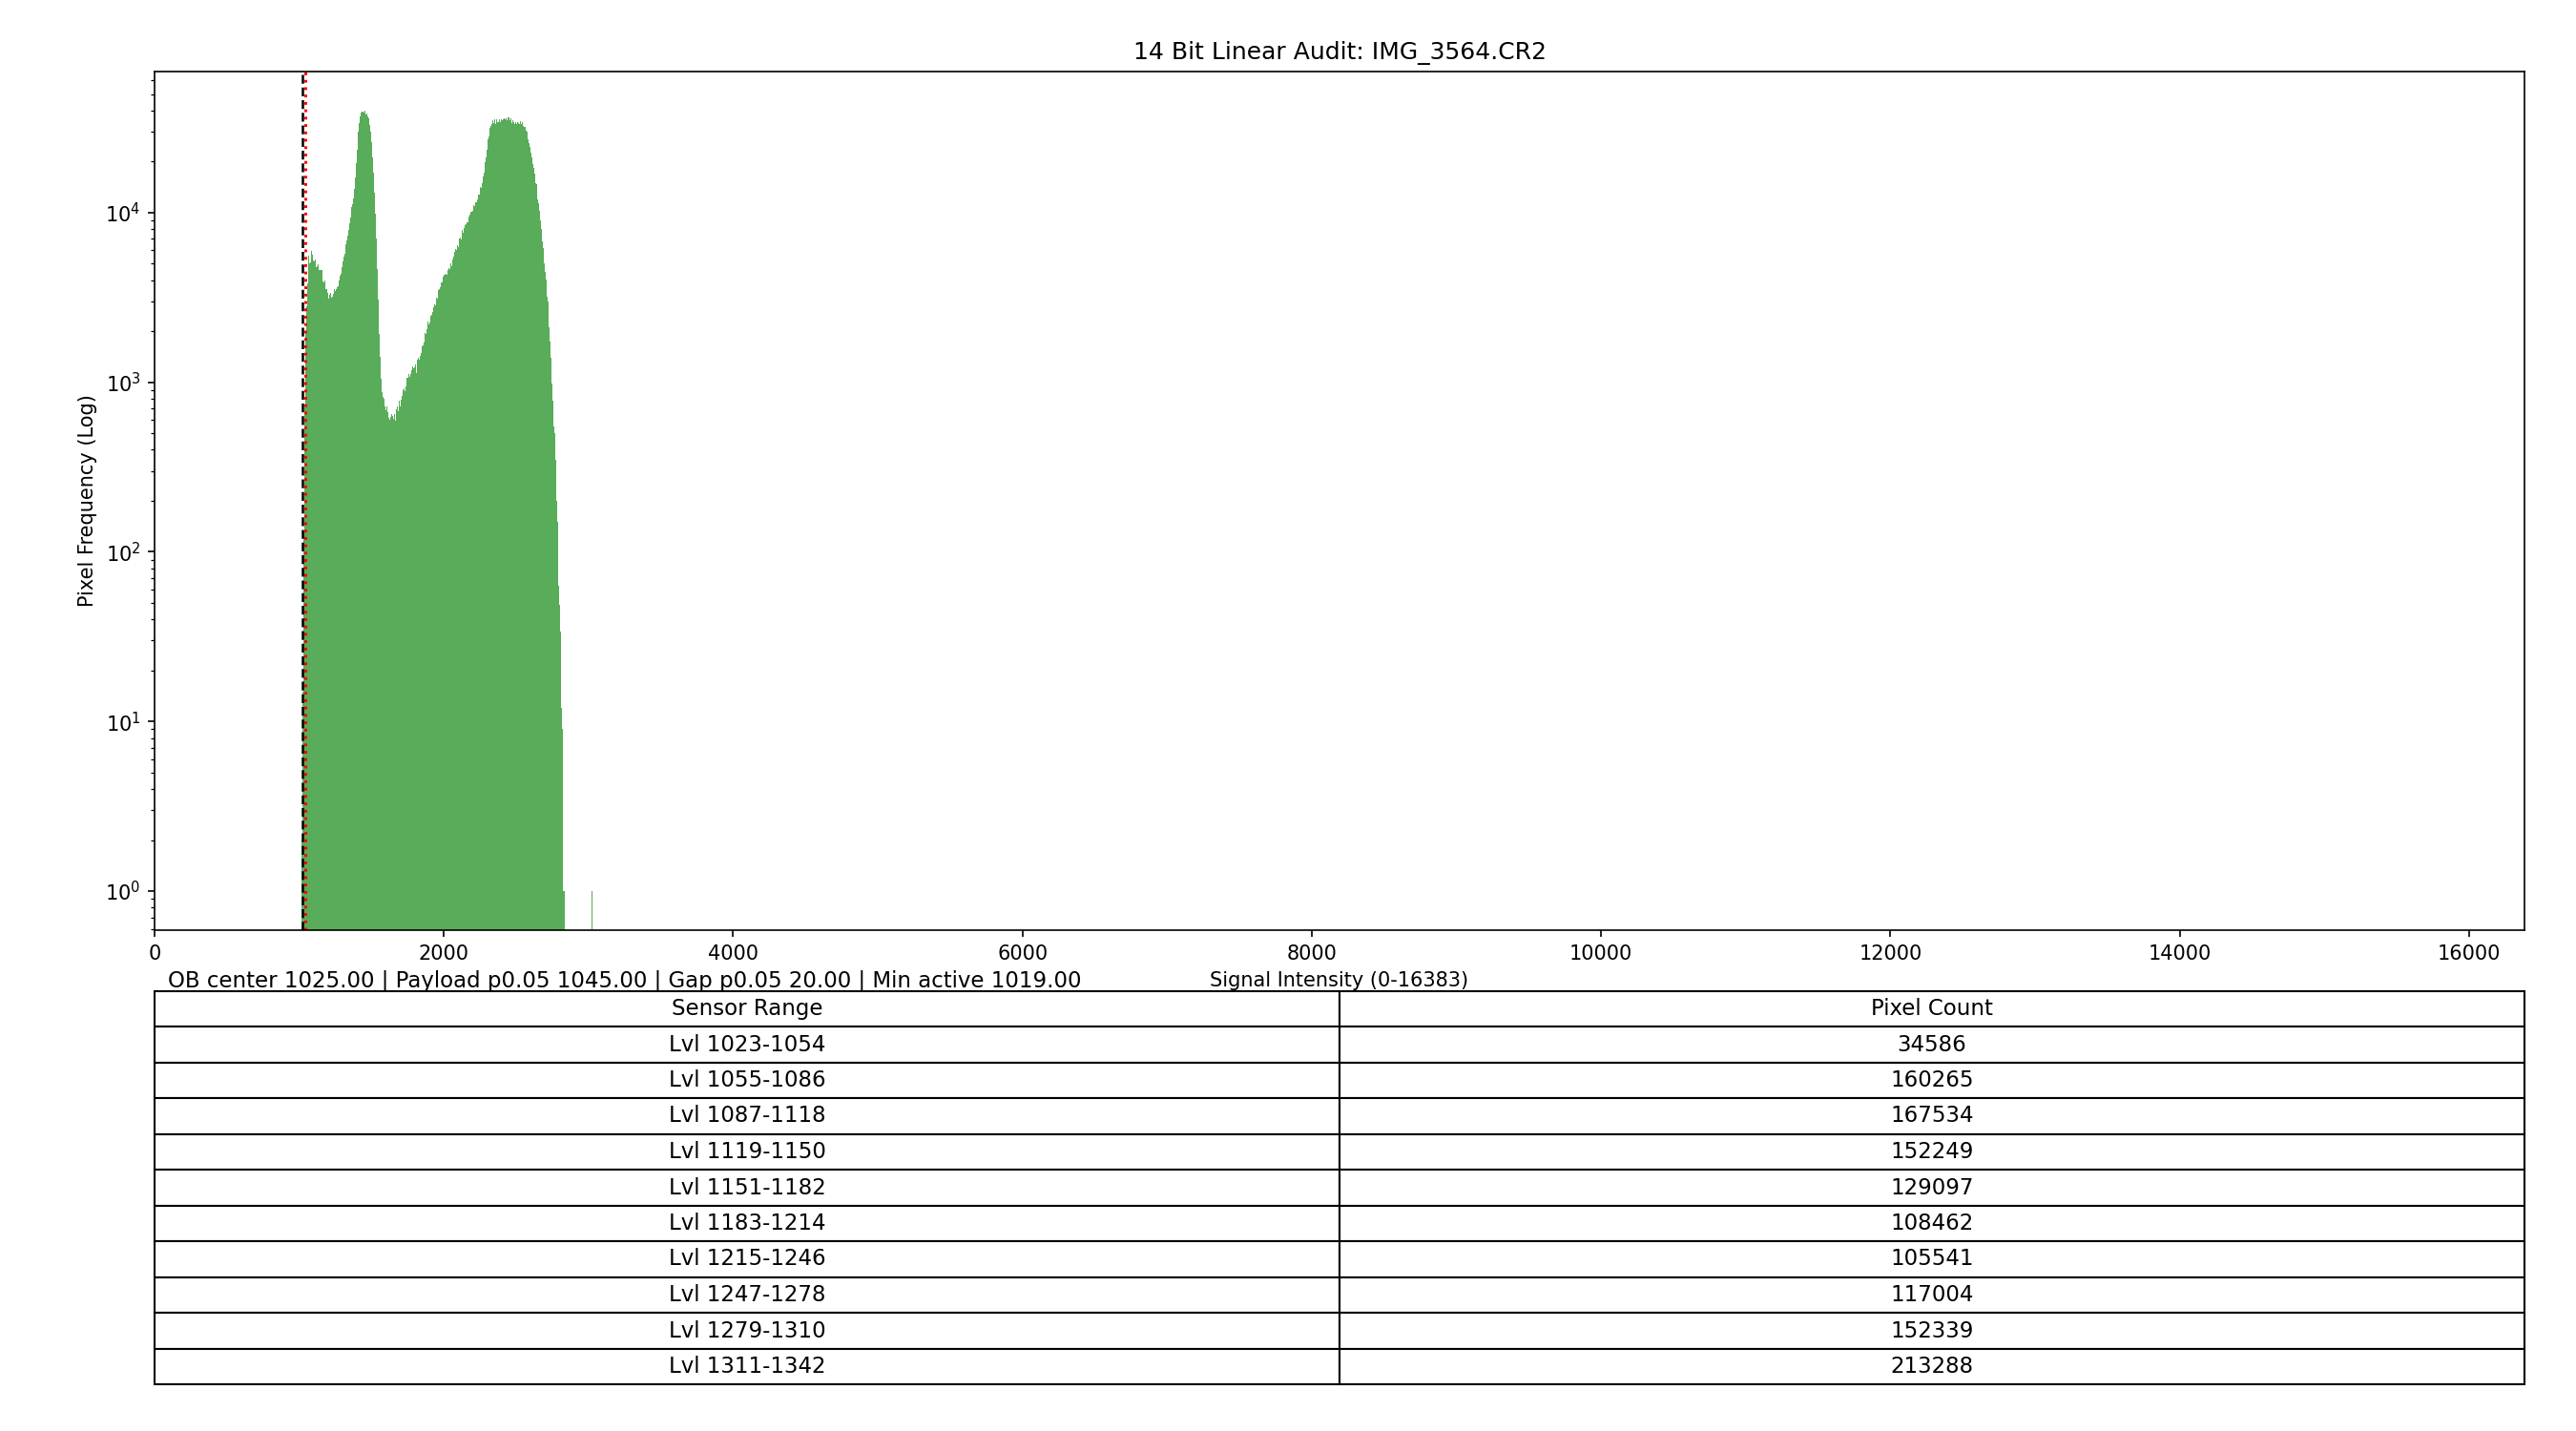
| Parameter | Value |
|---|---|
| OB Center | 1025 |
| Payload Start (p0.05) | 1045 |
| Gap | 20 levels |
| Lower Bin Population | Present |
Baseline Set 2: IMG_3560.CR2
Featureless sky — Canon 5D Mark II
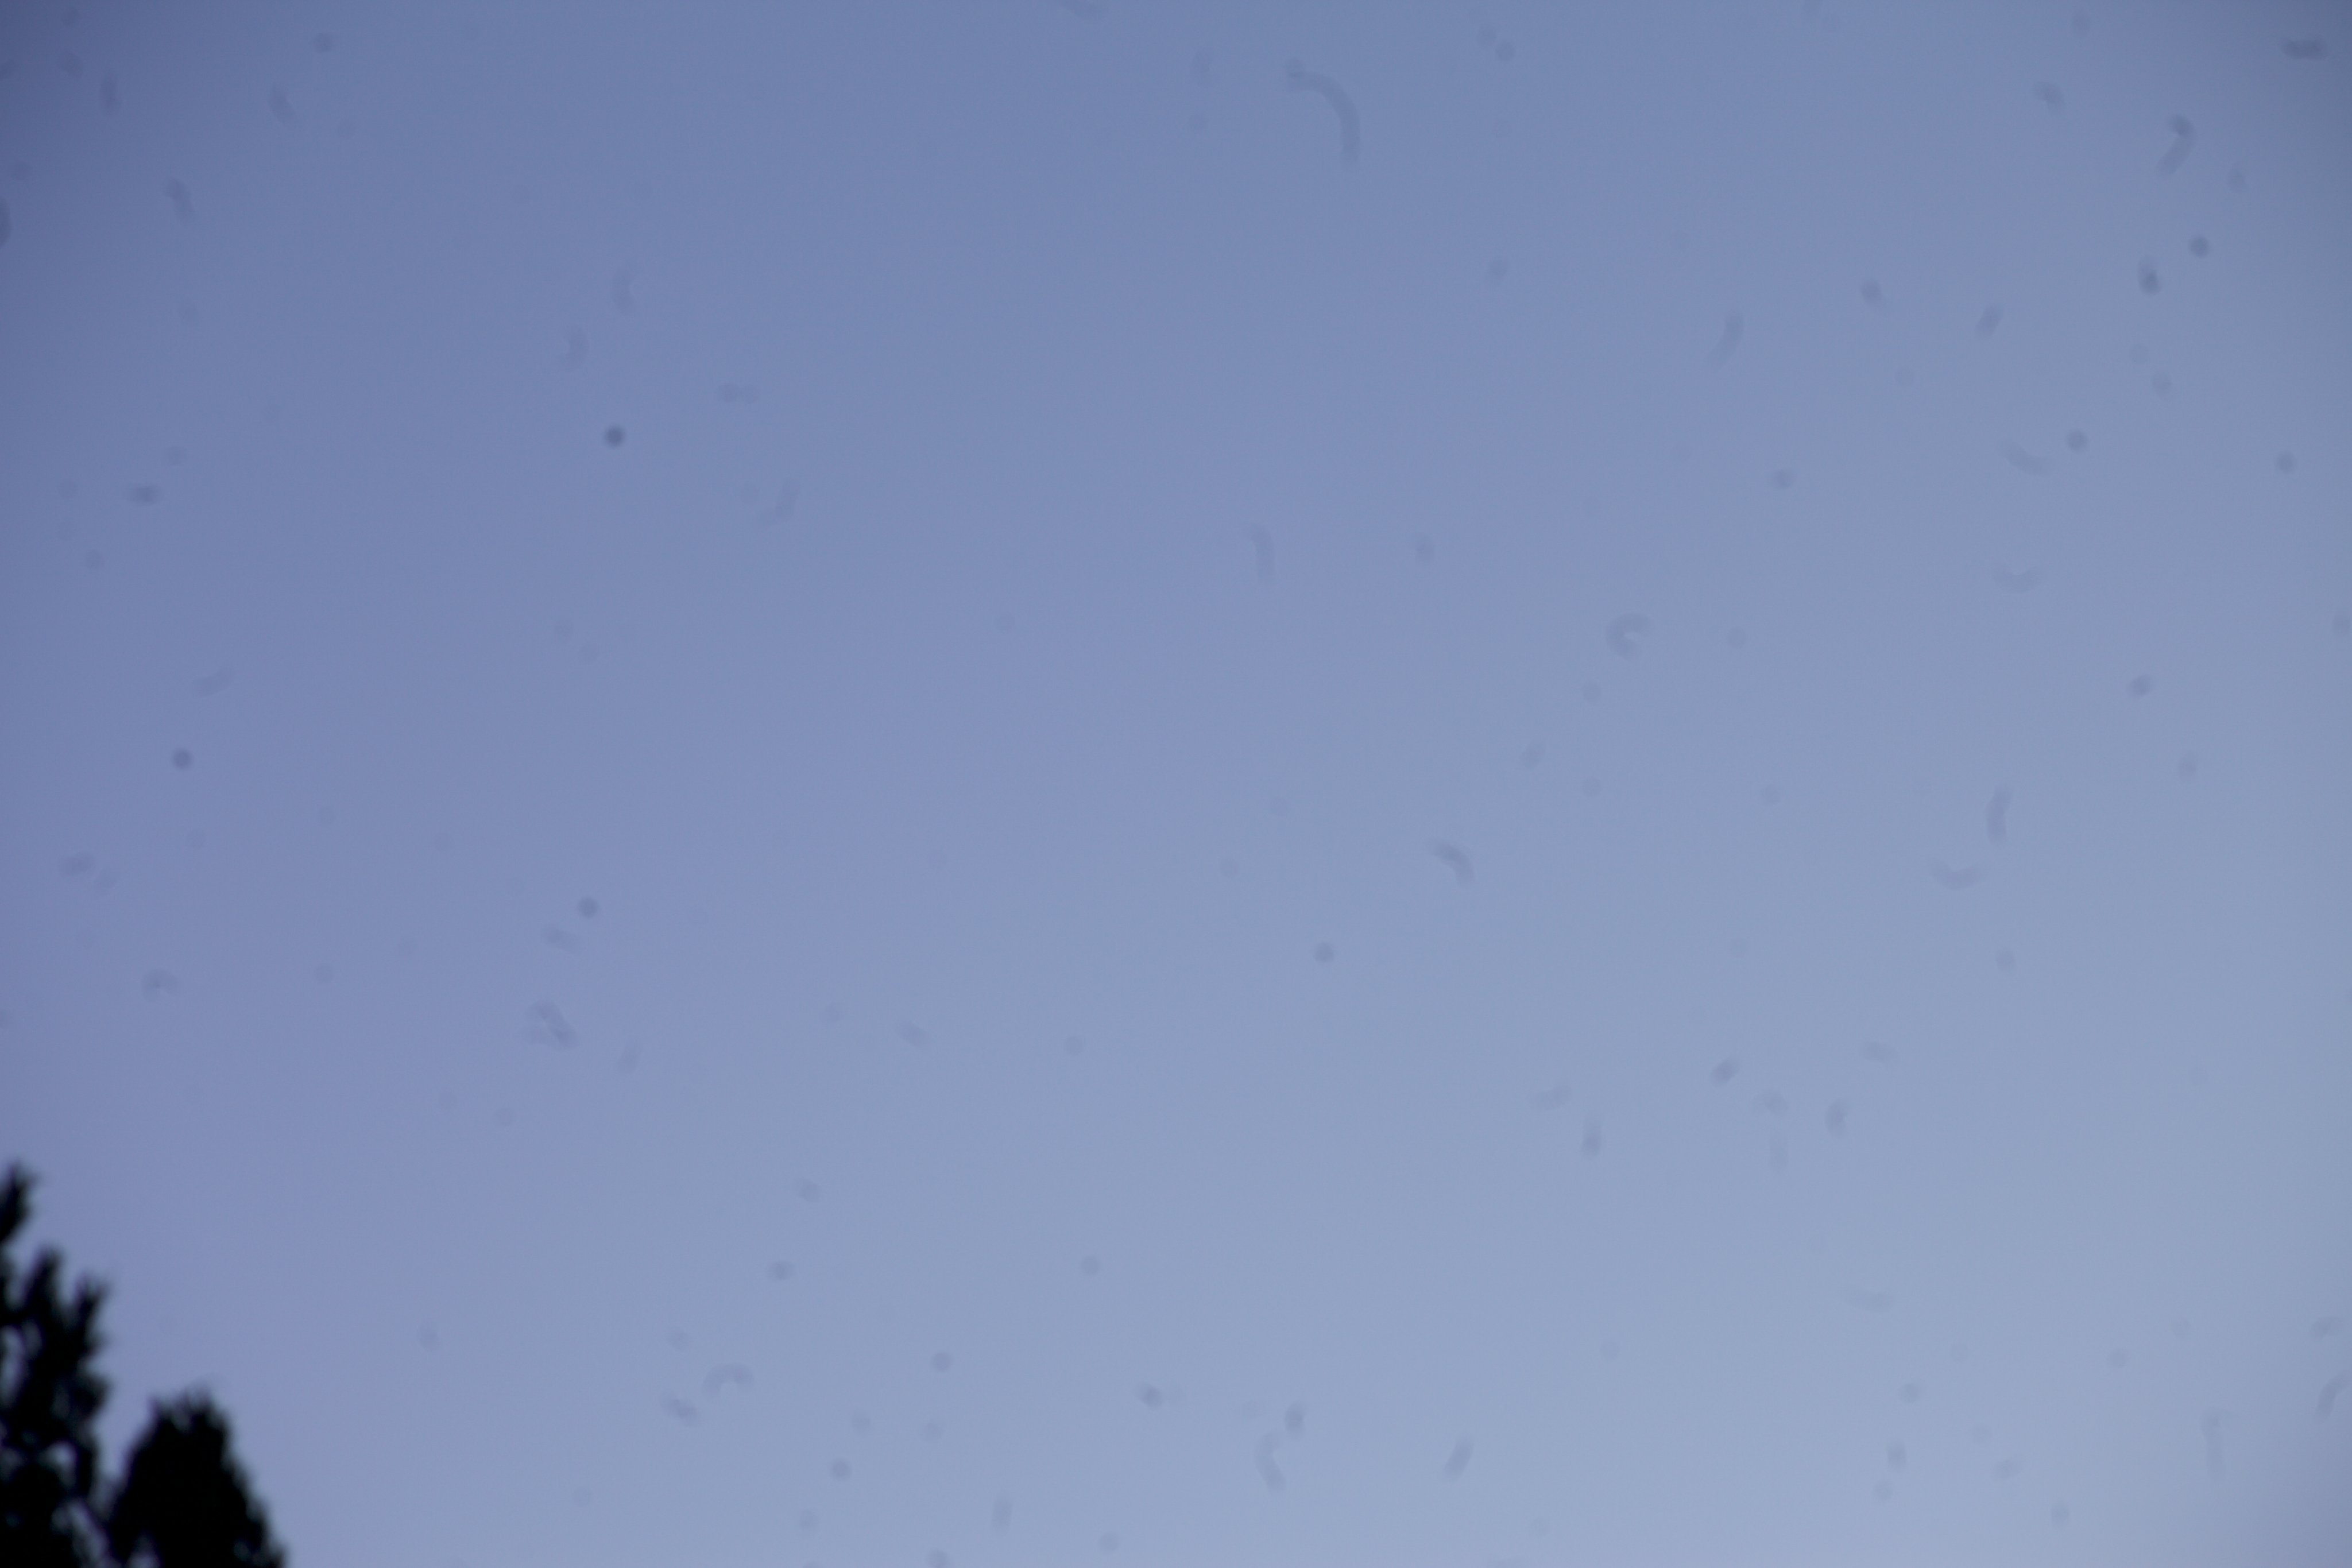
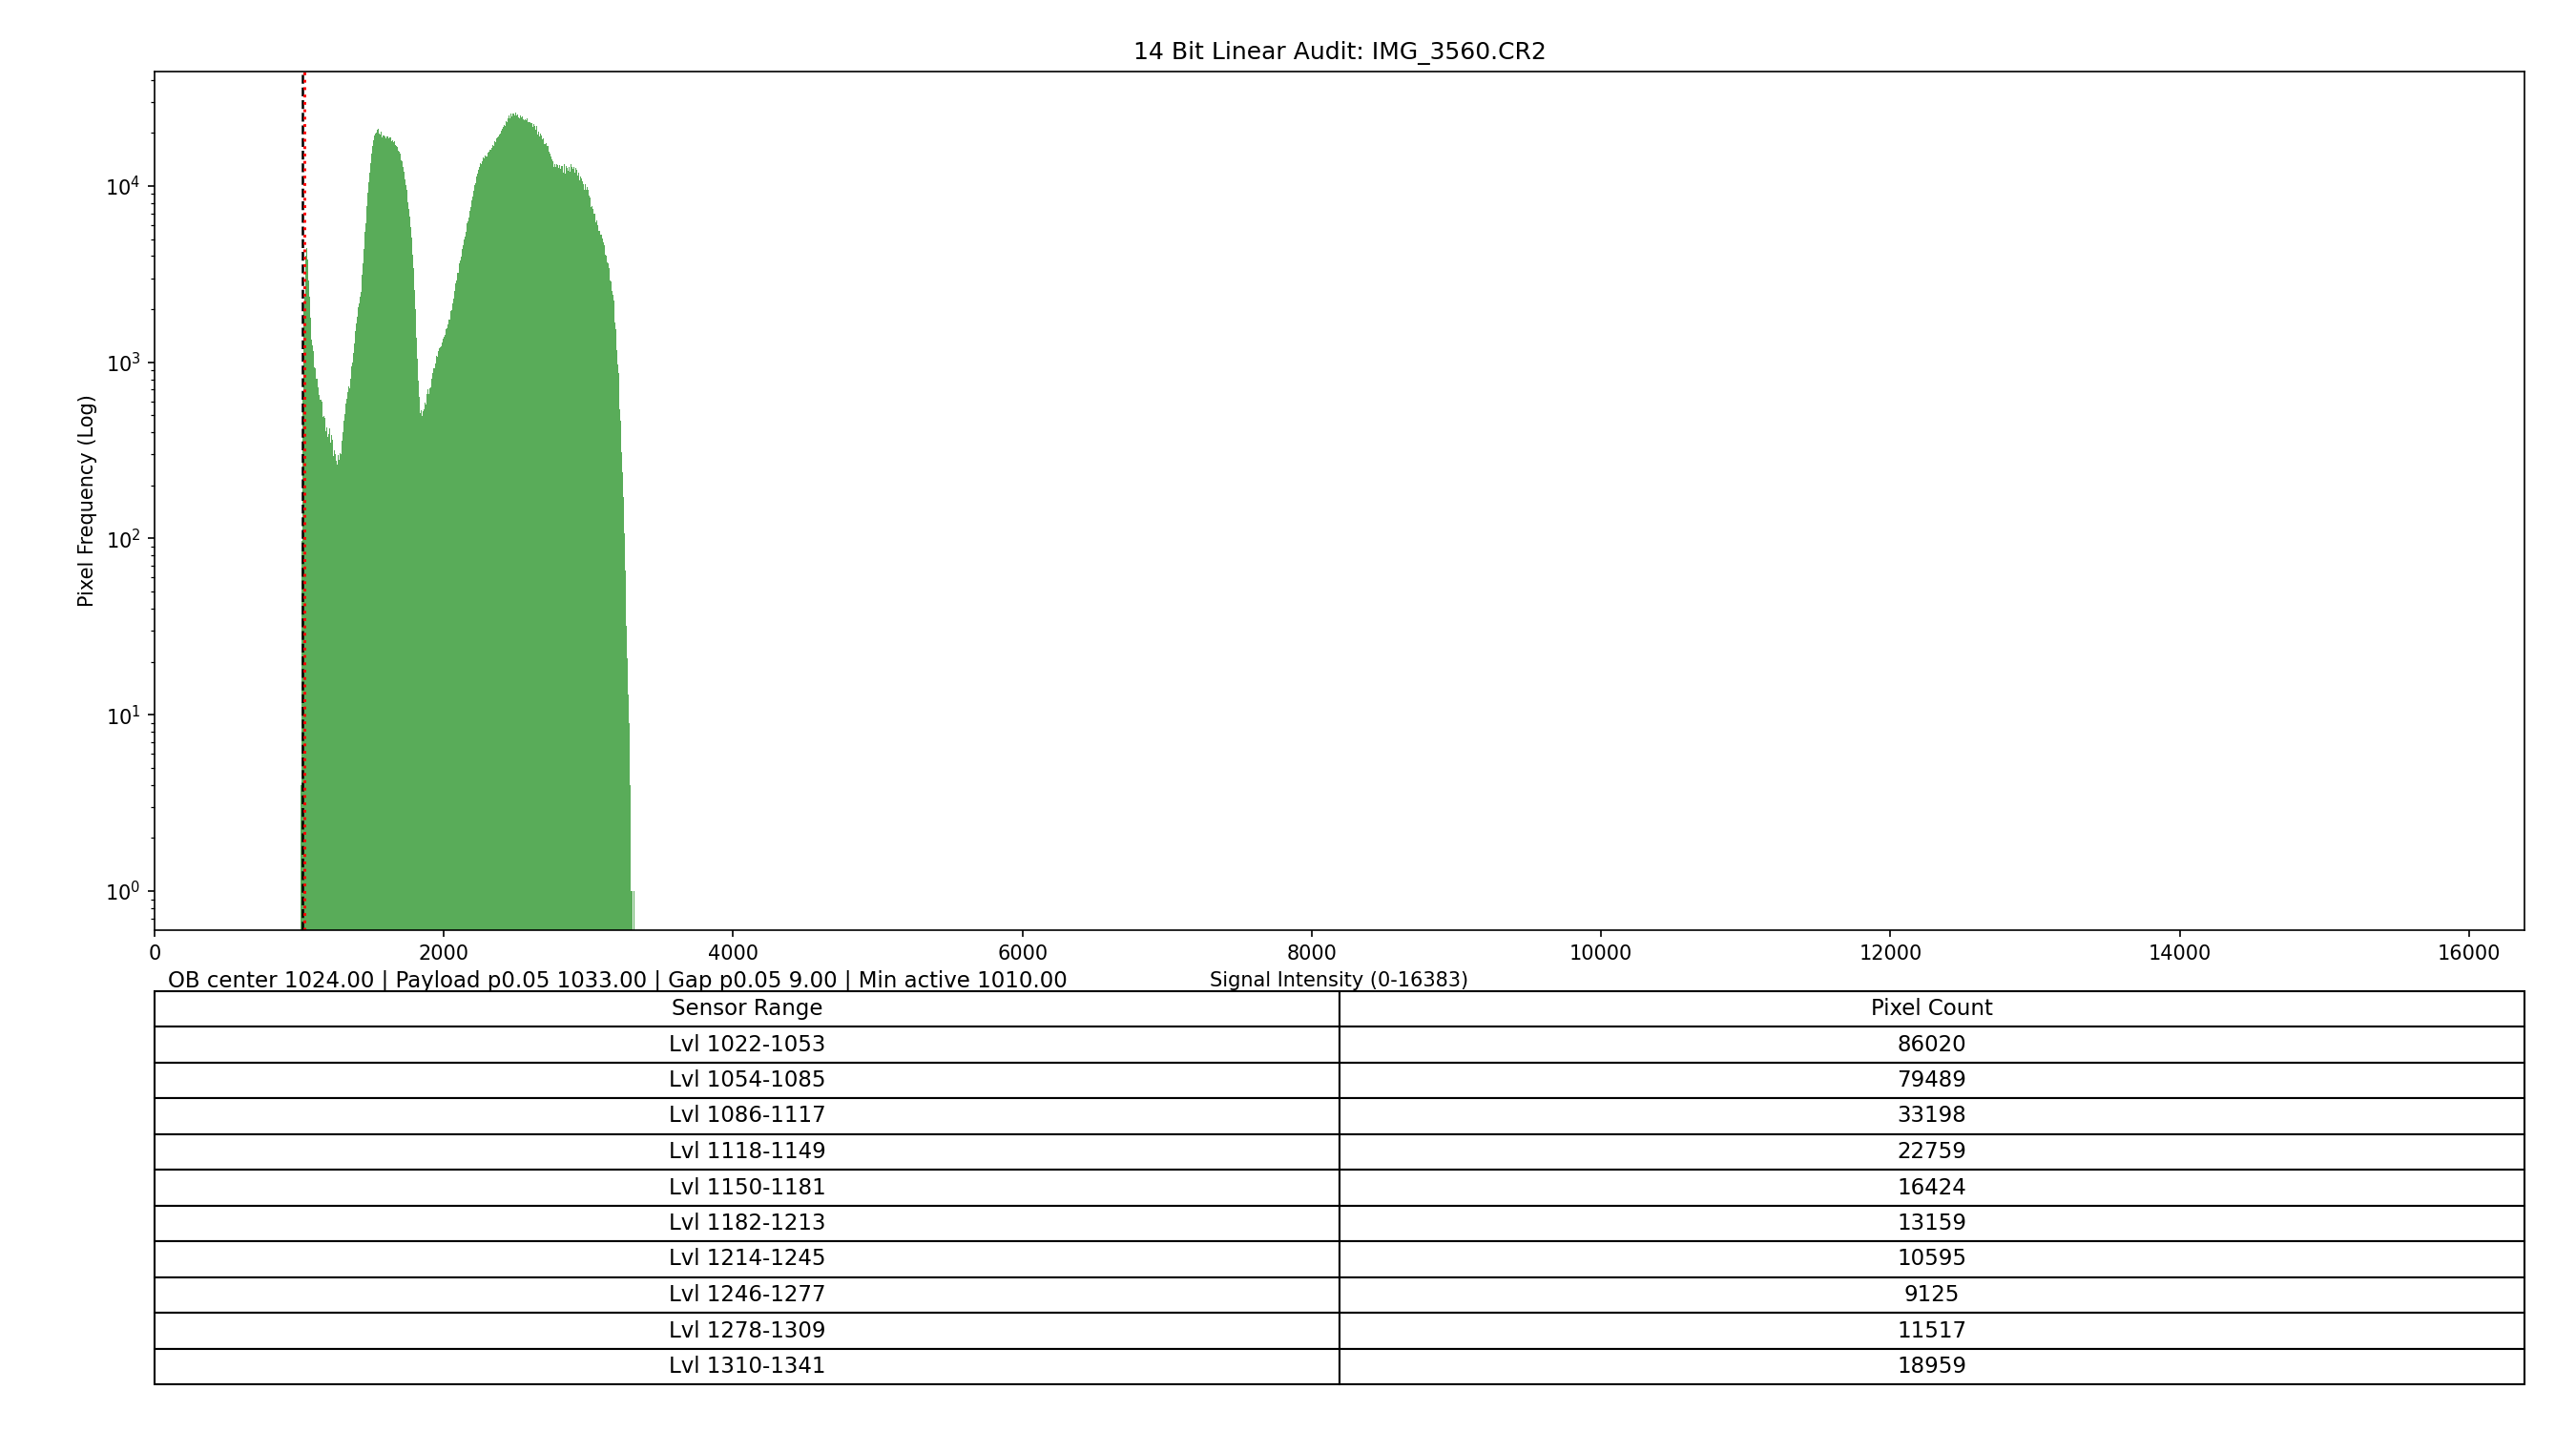
| Parameter | Value |
|---|---|
| OB Center | 1024 |
| Payload Start (p0.05) | 1033 |
| Gap | 9 levels |
| Lower Bin Population | Present |
Baseline Finding
Despite featureless subjects representing worst-case conditions for histogram variance, both captures show populated lower bins with continuous noise distribution from OB into the payload region. This confirms sensor noise is a hardware constant independent of scene content.
Generating Synthetic Cloud CR2: The Histogram Gap
Objective
Demonstrate that synthetic CR2 files created by inserting external images produce a detectable histogram anomaly—the missing noise floor.
Methodology
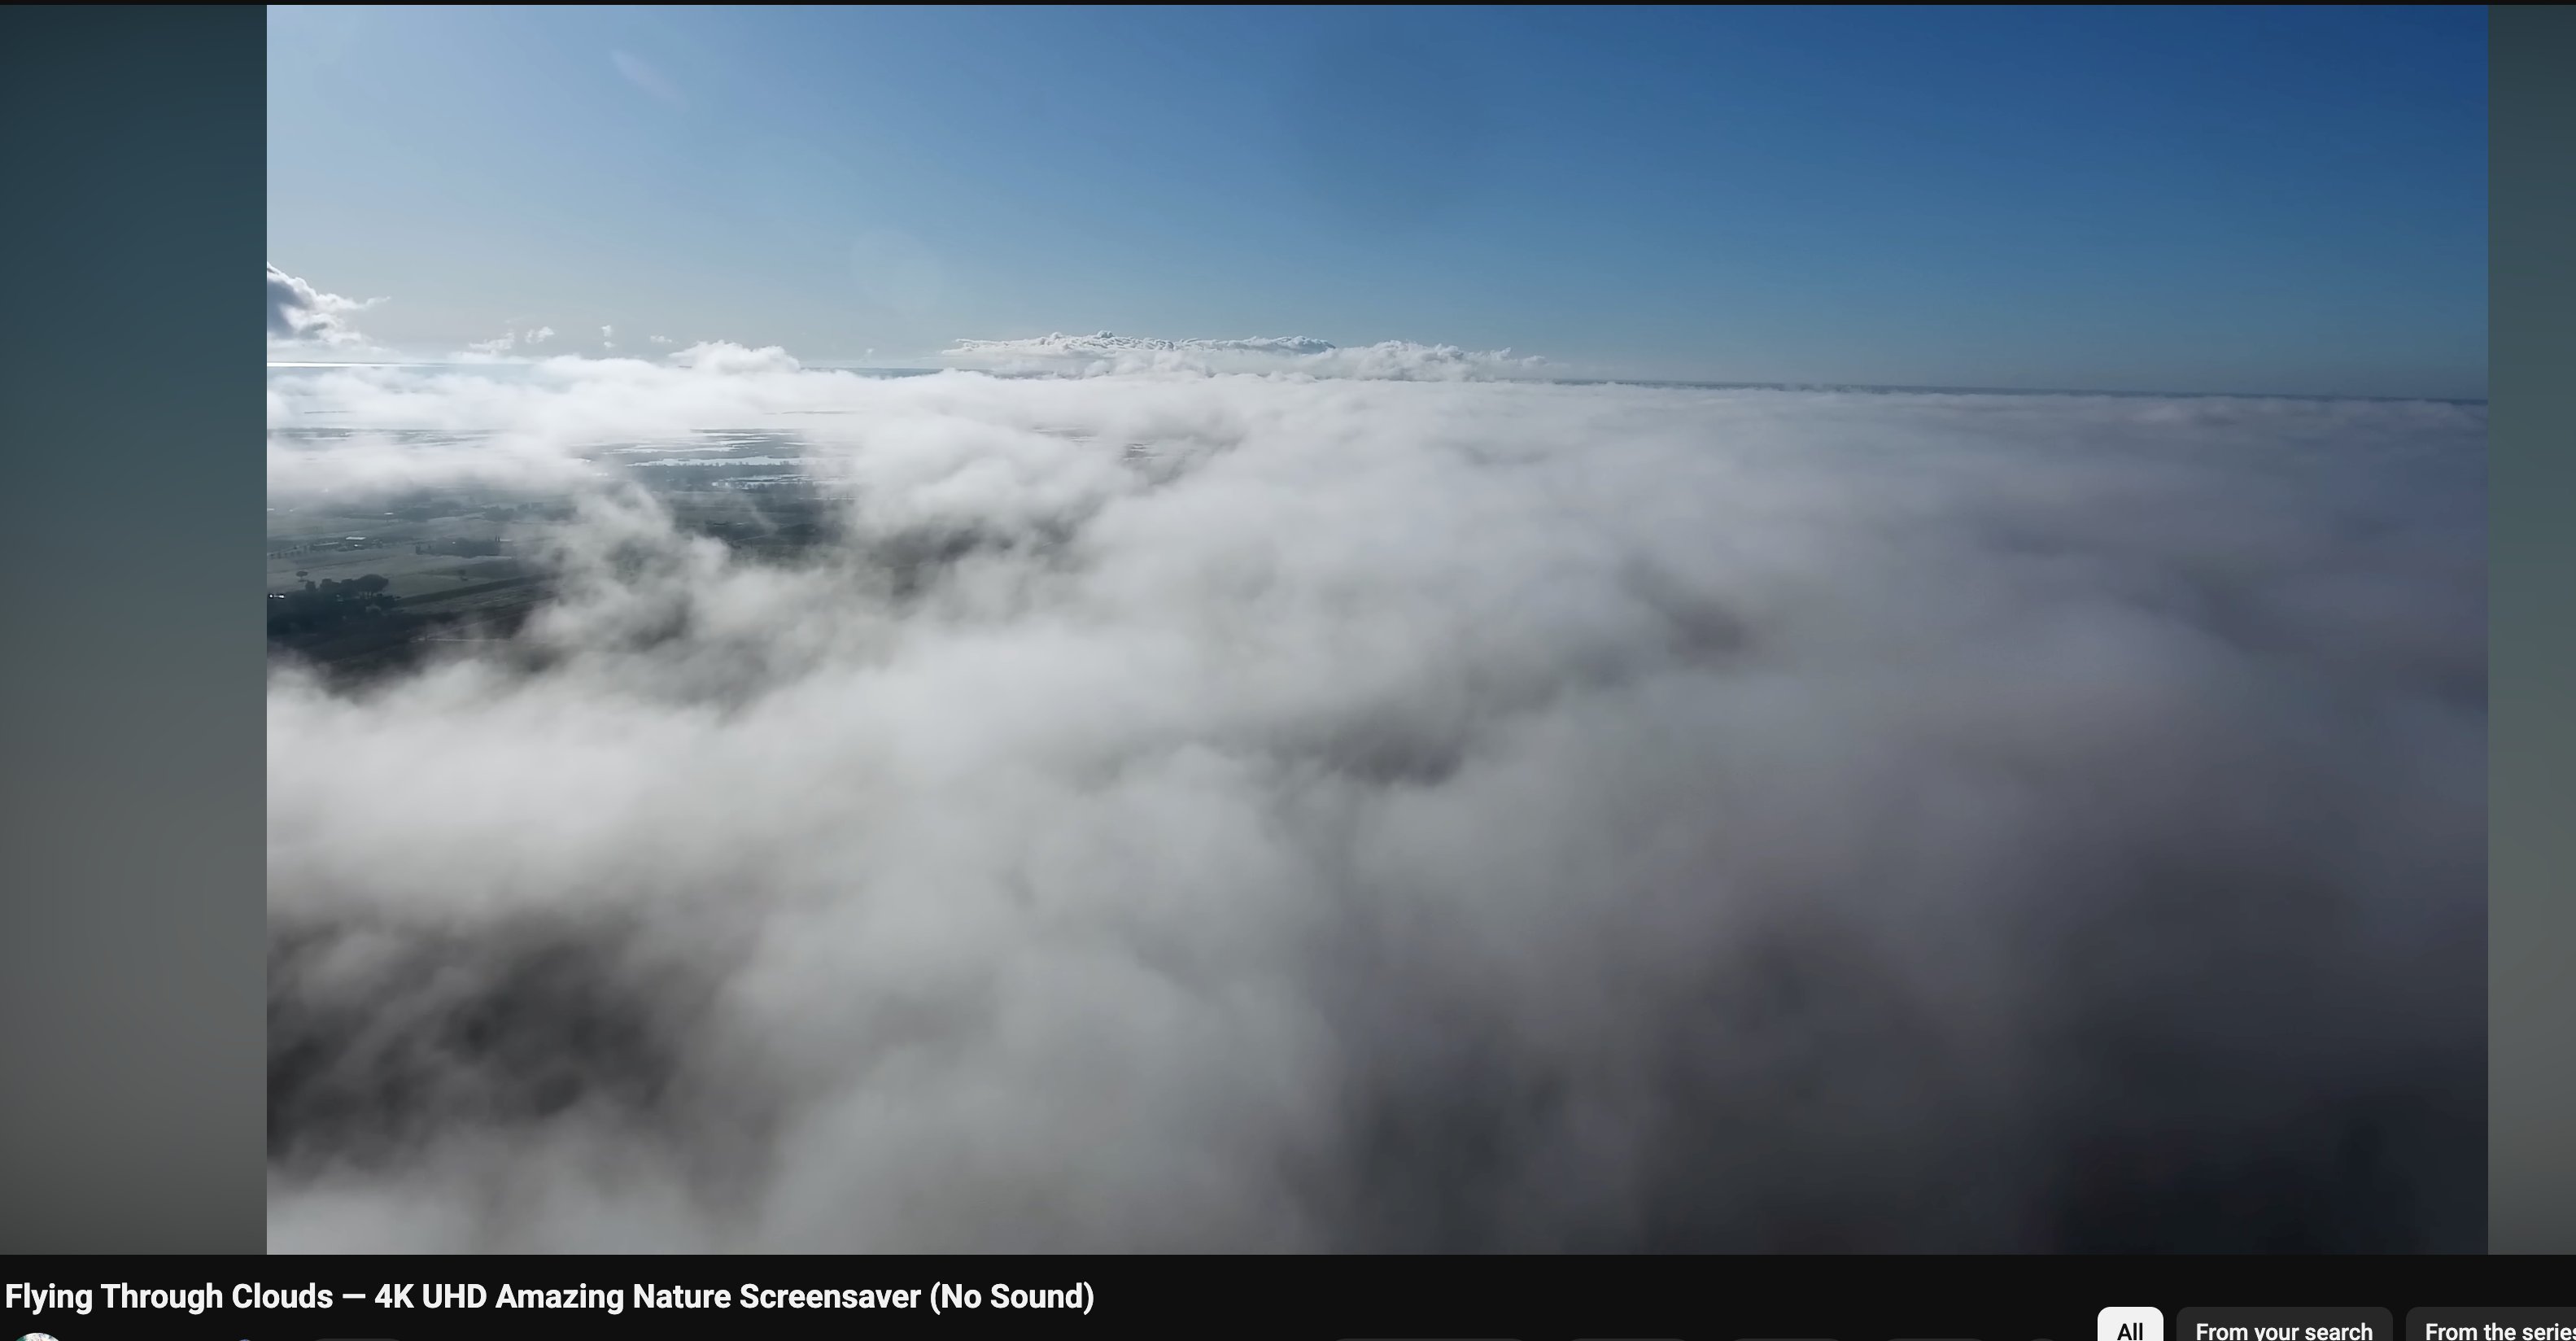
To replicate the methodology used in the Jonas synthetic image fraud, we captured screenshots from a public YouTube channel ("Flying Through Clouds — 4K UHD Amazing Nature Screensaver" by Aerial Earth) and inserted them into CR2 container files.
Synthetic Set 1: CL1.CR2
Source: YouTube screenshot — aerial clouds over fog
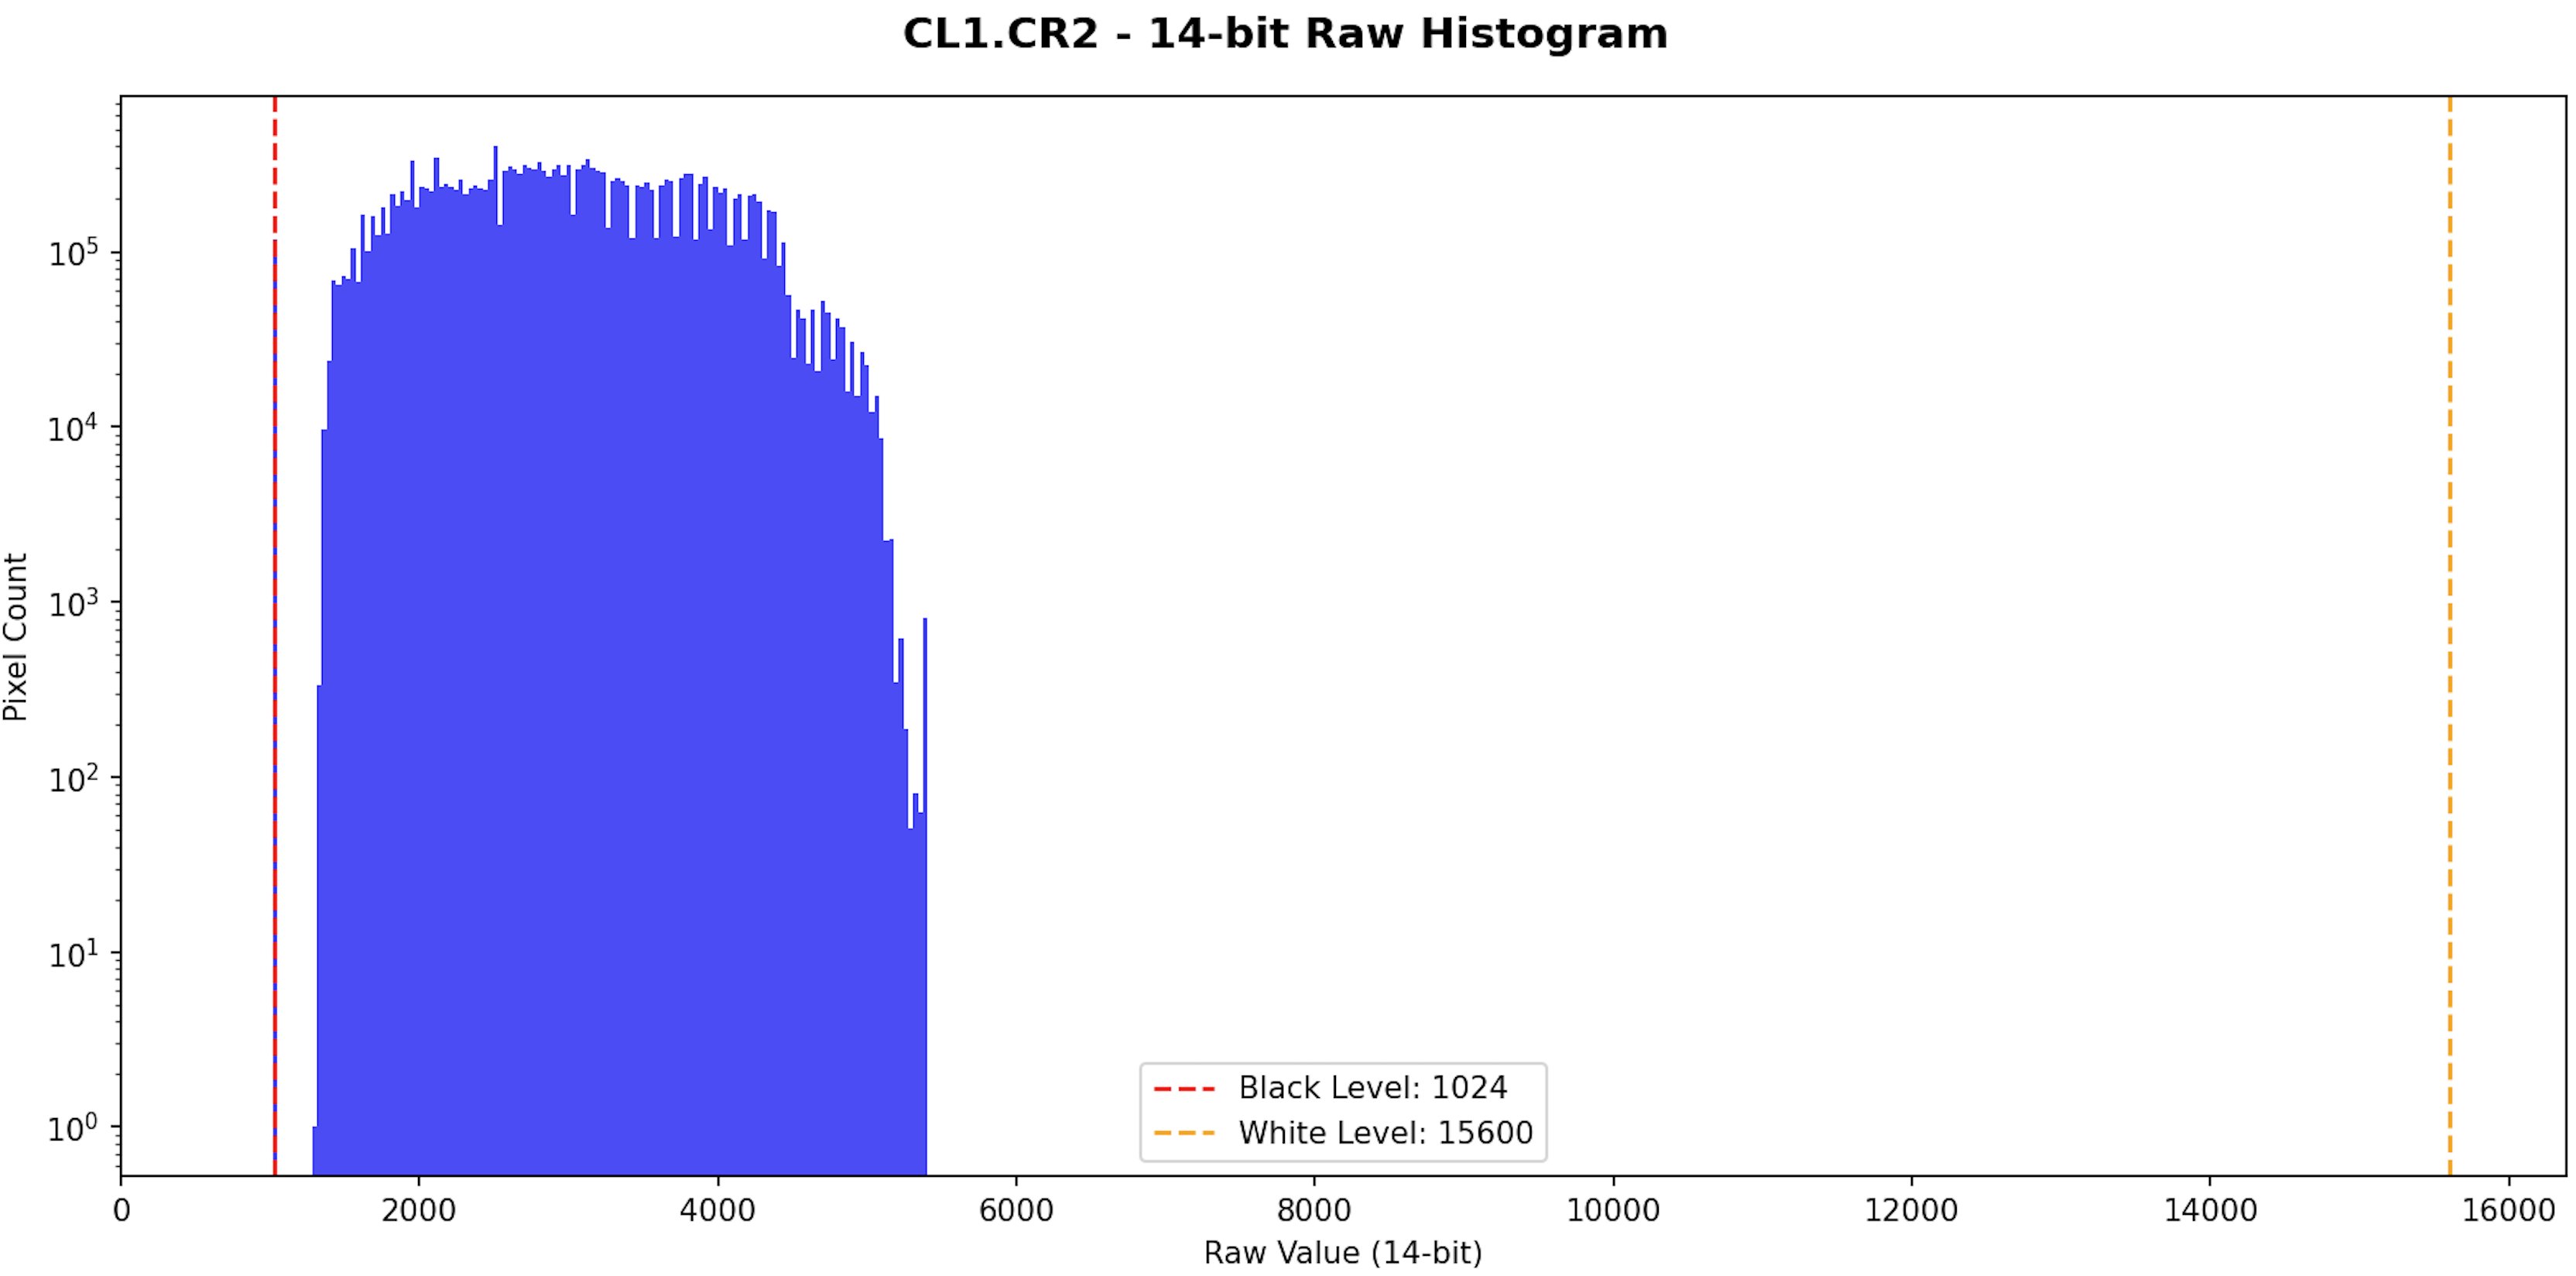
| Parameter | Value |
|---|---|
| Black Level | 1024 |
| Payload Start | ~1500 |
| Lower Bins (1024-1500) | Empty |
| Verdict | Synthetic |
Download: CL1.CR2
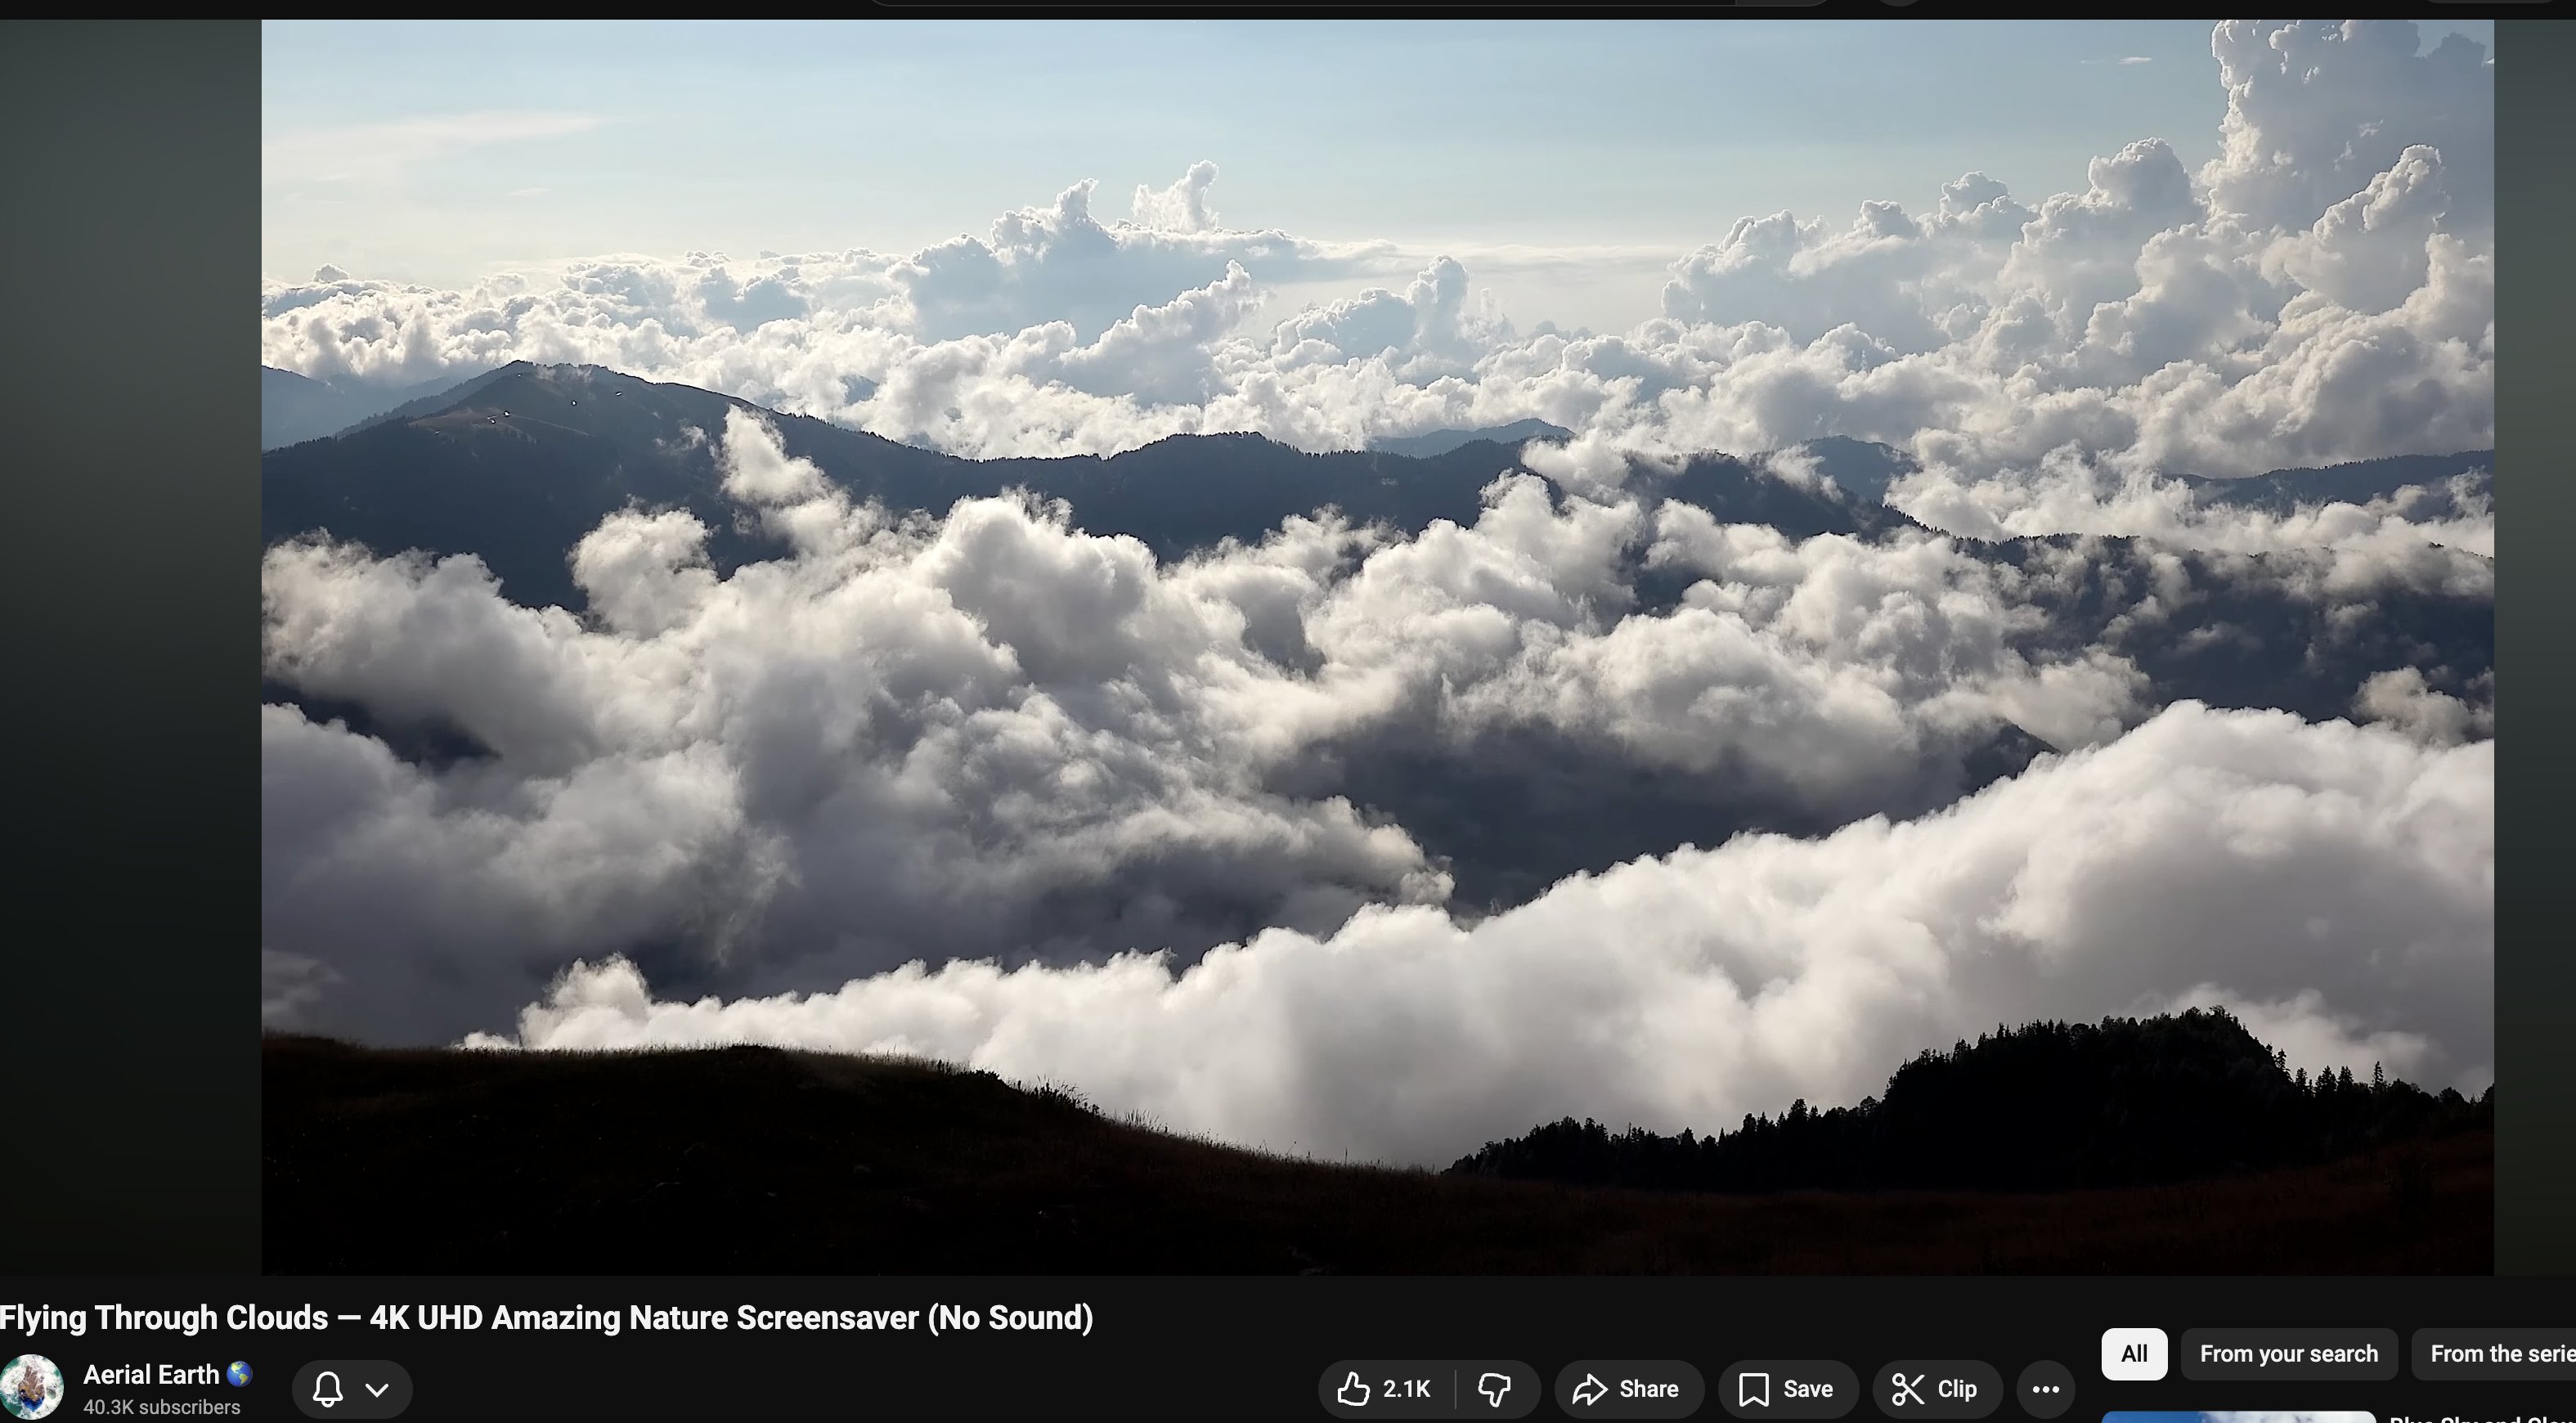
Synthetic Set 2: Cl.CR2
Source: YouTube screenshot — dramatic mountain clouds
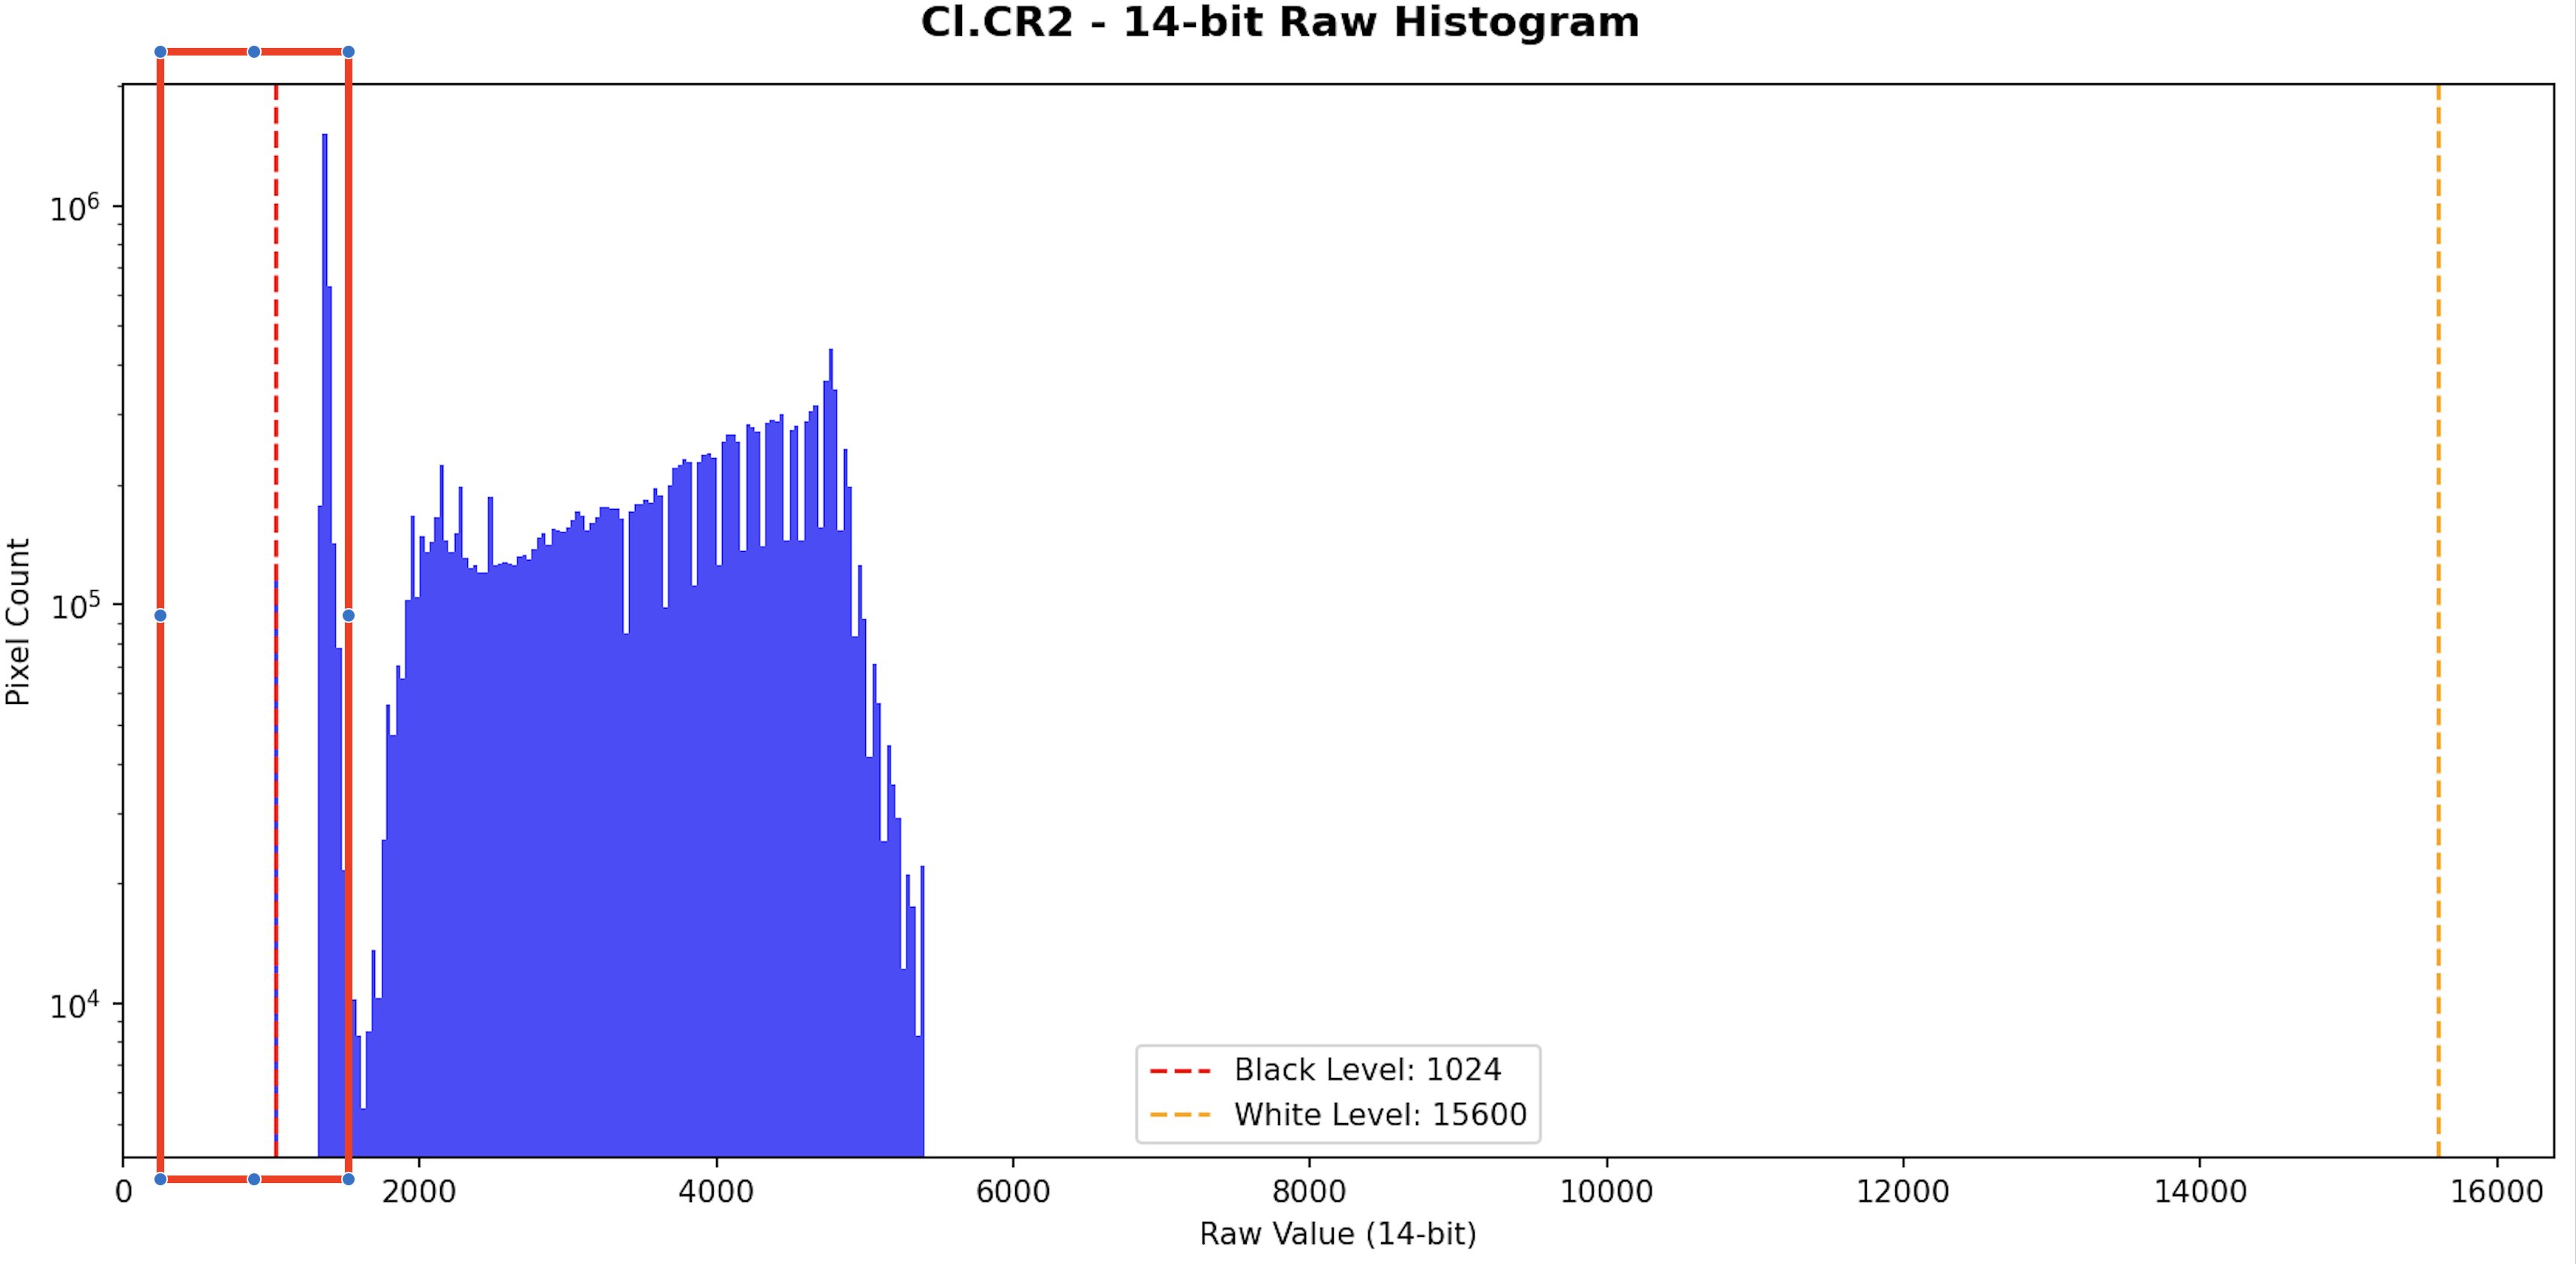
| Parameter | Value |
|---|---|
| Black Level | 1024 |
| Payload Start | ~1500 |
| Lower Bins (1024-1500) | Empty |
| Verdict | Synthetic |
Download: Cl.CR2
Synthetic Set 3: Cl4.CR2
Source: Aerial photograph — islands/coastline from airplane

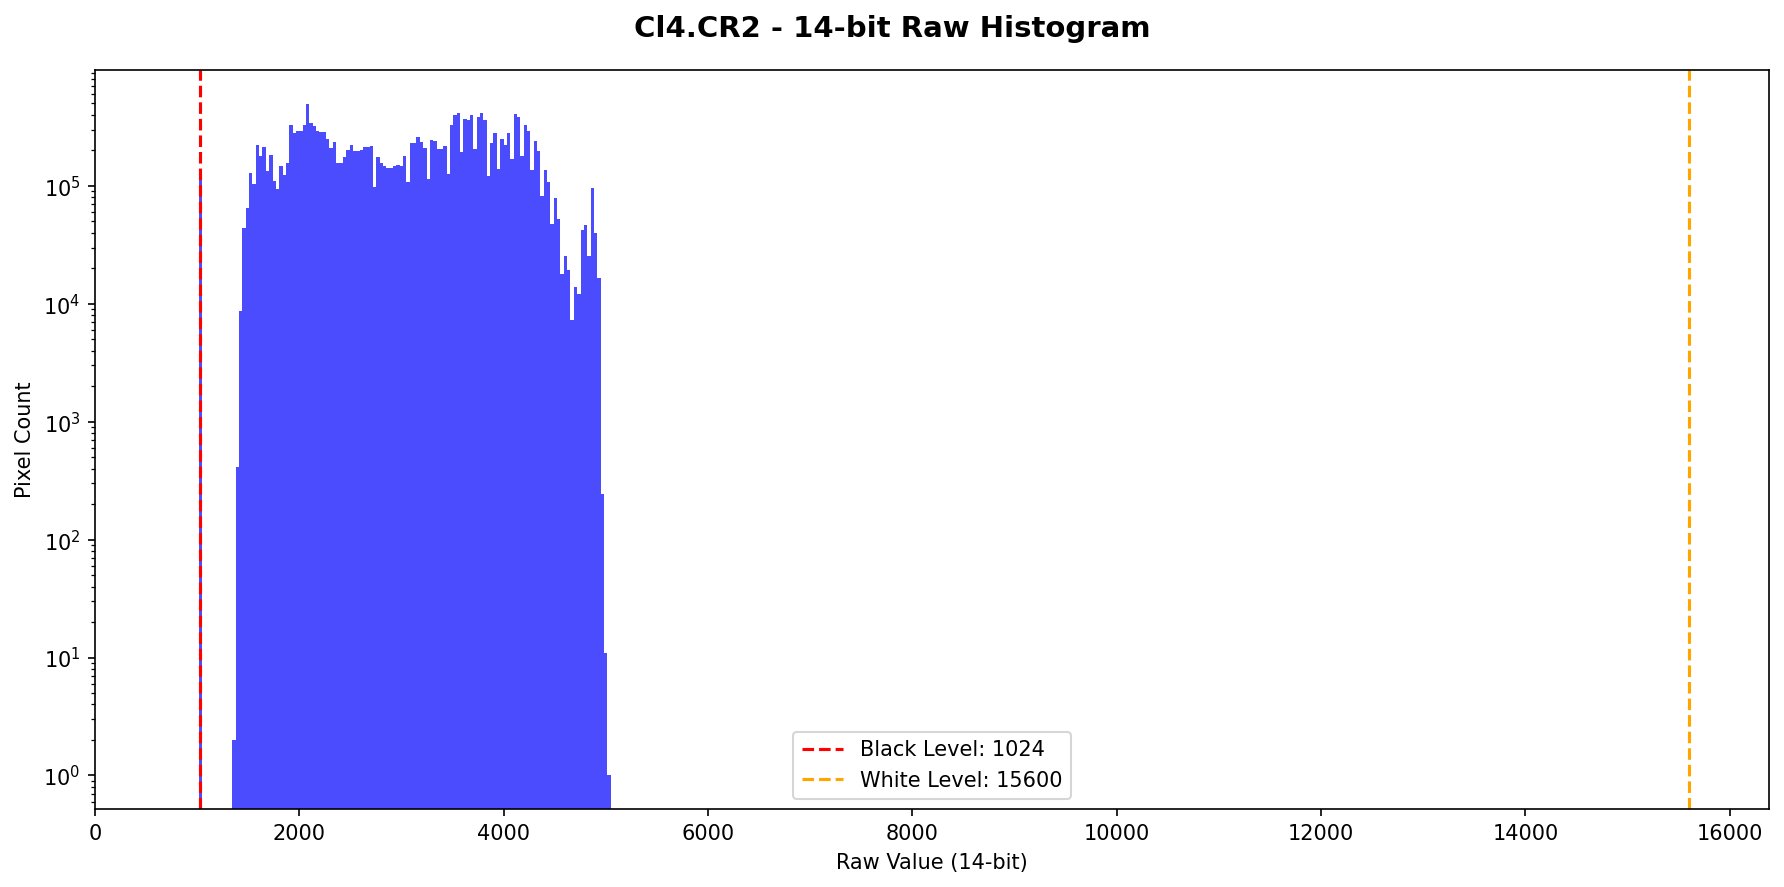
| Parameter | Value |
|---|---|
| Black Level | 1024 |
| Payload Start | ~1500 |
| Lower Bins (1024-1500) | Empty |
| Verdict | Synthetic |
Download: Cl4.CR2
Synthetic Finding
All three synthetic CR2 files exhibit the same forensic fingerprint:
- Empty lower bins — The region between Black Level (1024) and ~1500 contains no pixel data
- Abrupt payload start — Data begins sharply without the gradual noise transition seen in authentic captures
- Missing sensor noise floor — Real CMOS sensors always produce read noise that populates these bins
The Ultimate Forgery Test: Original Preview Re-Insertion
Objective
To conclusively validate our detection methodology, we performed the definitive test: taking pristine, authentic CR2 files with no histogram gap, extracting their own embedded JPEG preview, and re-inserting that preview back into the CR2 container.
Hypothesis: If the histogram gap is a reliable indicator of synthetic manipulation, it must appear even when using image data derived from the original authentic capture itself.
Methodology
- Source File: IMG_3564.CR2 — Pristine original with confirmed populated lower bins
- Extraction: Embedded JPEG preview extracted from the CR2 container
- Re-Insertion: Extracted JPEG inserted back into a CR2 container using the same process employed in Jonas-style synthetic image creation
- Analysis: 14-bit linear histogram examined for noise floor characteristics
Result: IMG_3564_reinserted.CR2
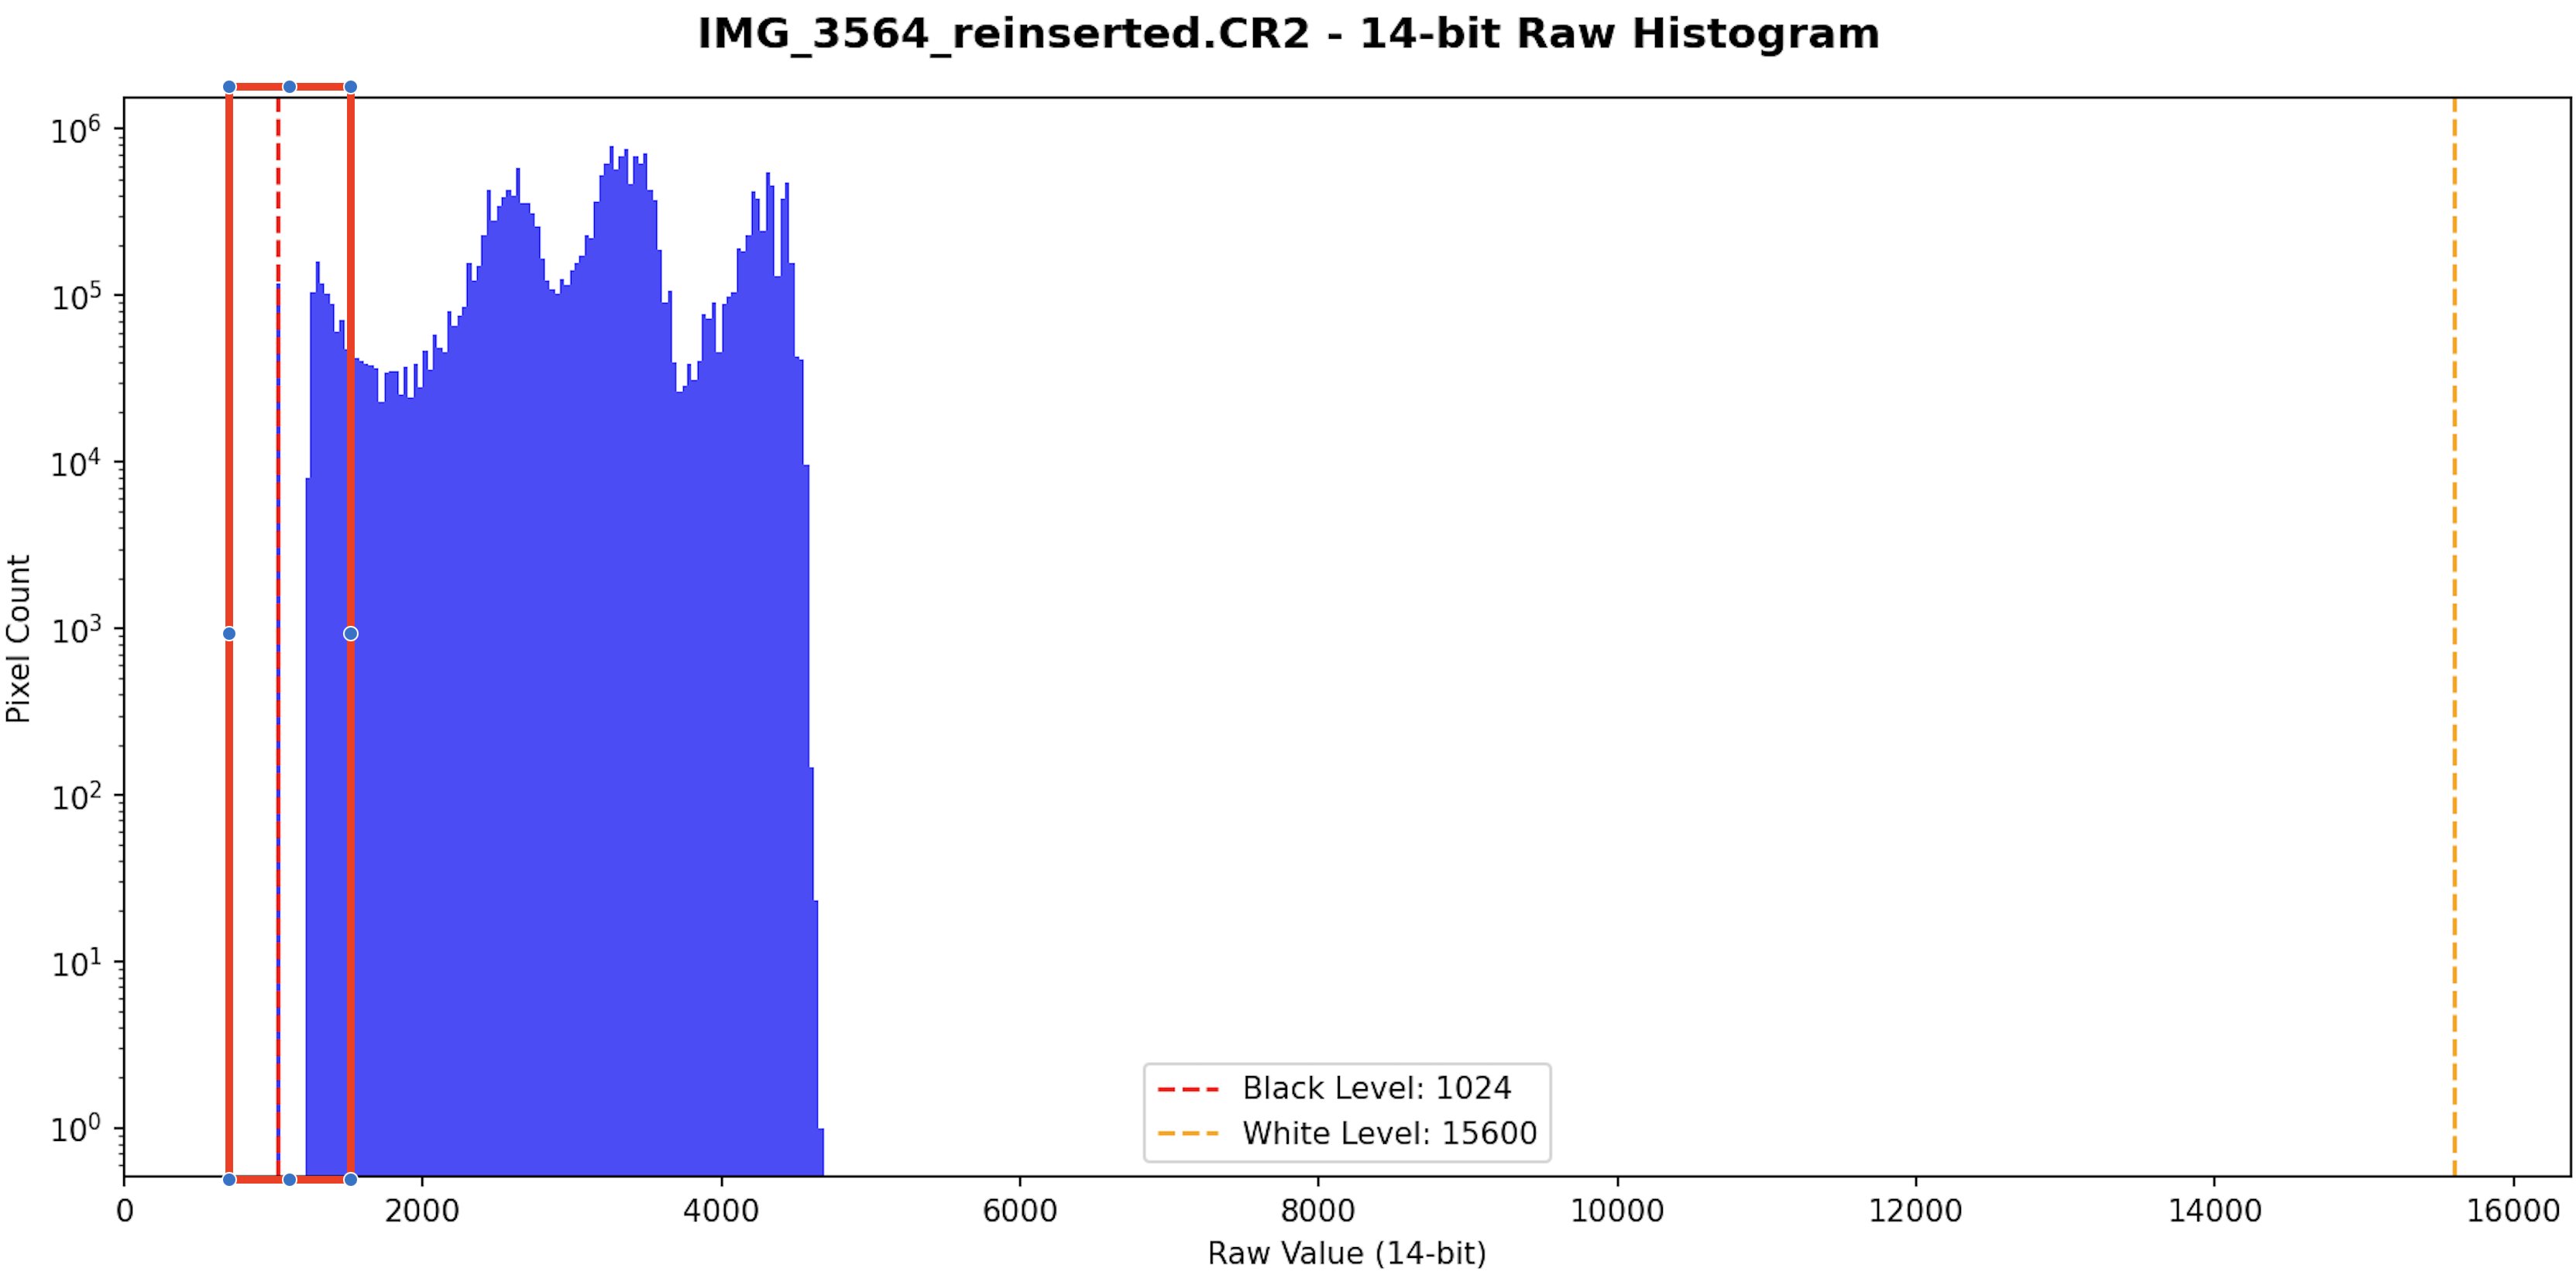
| Parameter | Original | Re-Inserted |
|---|---|---|
| Lower Bins (1024-1100) | Populated | Empty |
| Noise Floor | Present | Absent |
| Gap | None | ~500 levels |
| Verdict | Authentic | Synthetic |
Technical Explanation
The gap appears despite using the same scene from the same camera at the same moment. No external image source was involved—identical visual content.
Why the gap appears: The JPEG encoding pipeline permanently destroys sensor-level data:
- Demosaicing interpolates RAW Bayer data into RGB
- White balance and tone curves remap intensity values
- Lossy compression quantizes and discards sub-threshold information
- 8-bit encoding truncates 14-bit precision
When re-inserted, the processed 8-bit JPEG values are scaled back to 14-bit space, but the original sensor noise cannot be reconstructed. The result is a "clean" signal with an abrupt start—the unmistakable fingerprint of synthetic origin.
Ultimate Test Conclusion
This proves definitively:
Any synthetic imagery created through the same process as the Jonas fake images—regardless of source—will exhibit histogram gaps indicative of:
- Sensor floor scrubbing — The removal of inherent CMOS noise characteristics
- Synthetic origin — Image data that did not originate from the sensor's direct capture
- Manipulated CR2 files — RAW containers with replaced payload data
The histogram gap is not dependent on the quality, source, or sophistication of the inserted image. It is an unavoidable artifact of any insertion process, making it a forensically reliable indicator of CR2 manipulation.
Jonas Fake Cloud Image histograms (Red)
The Histogram 'Fingerprint' of Fraud—Jonas 14 bit RAW histograms scream fraud. They have no sensor shot or thermal noise, it's just hollowed out container with all essential elemnts removed, and replaced carefully with just a fragile image that has no dynamic range so it can survive the image to RAW transformation, and back to image. This exposes the manipulation. Notice the isolated, narrow signal spike (the 'weak image'), but look closely at what is missing: the Noise Floor.
- The Evidence: In a genuine raw capture, the far left (the deep shadows) is always messy with Thermal and Shot noise. Here, the table confirms the pixel count is a flat zero in those lower ranges.
- The Verdict: Real hardware is never silent. This unnatural emptiness proves the sensor was effectively 'never turned on.' The file is a shell; the original data was likely hollowed out and replaced with a fake payload—a synthetic image that fails to mimic the noisy, physical signature of a real sensor."
Scientifically Proven Insertion Fraud This is a textbook case of CR2 manipulation. Any forensic expert or university researcher who extracts RAW histograms from the Jonas images will reach the same conclusion: they are inauthentic. We have reproduced these exact histogram spikes in the lab—we know they are manufactured.
The 'Dead Zone' Evidence
Real sensors generate 'Dynamic Black'—a baseline of thermal and electrical noise at the far left of the histogram. In these files, that space is a Dead Zone: a complete vacuum of data between the black point and the image signal.
- The Physics: An empty noise floor means there was no electrical activity in the sensor.
- The Verdict: The camera did not take this picture. The image data was inserted into a hollow CR2 file. These are confirmed fakes
![14-Bit Linear Audit: IMG_1837.cr2 [JONAS_CLOUD] - Red histogram showing dead zone fraud](images/img-002.png)
| Sensor Range | Pixel Count |
|---|---|
| Lvl 1023-1024 | 0 |
| Lvl 1025-1056 | 0 |
| Lvl 1057-1088 | 0 |
| Lvl 1089-1120 | 0 |
| Lvl 1121-1152 | 0 |
| Lvl 1153-1184 | 0 |
| Lvl 1185-1216 | 0 |
| Lvl 1217-1248 | 0 |
| Lvl 1249-1280 | 0 |
![14-Bit Linear Audit: IMG_1827.CR2 [JONAS_CLOUD] - Red histogram showing dead zone fraud](images/img-003.png)
| Sensor Range | Pixel Count |
|---|---|
| Lvl 1023-1024 | 0 |
| Lvl 1025-1056 | 0 |
| Lvl 1057-1088 | 0 |
| Lvl 1089-1120 | 0 |
| Lvl 1121-1152 | 0 |
| Lvl 1153-1184 | 0 |
| Lvl 1185-1216 | 0 |
| Lvl 1217-1248 | 18 |
| Lvl 1249-1280 | 10298 |
![14-Bit Linear Audit: IMG_1828.CR2 [JONAS_CLOUD] - Red histogram showing dead zone fraud](images/img-004.png)
| Sensor Range | Pixel Count |
|---|---|
| Lvl 1023-1024 | 0 |
| Lvl 1025-1056 | 0 |
| Lvl 1057-1088 | 0 |
| Lvl 1089-1120 | 0 |
| Lvl 1121-1152 | 0 |
| Lvl 1153-1184 | 0 |
| Lvl 1185-1216 | 0 |
| Lvl 1217-1248 | 0 |
| Lvl 1249-1280 | 0 |
![14-Bit Linear Audit: IMG_1829.CR2 [JONAS_CLOUD] - Red histogram showing dead zone fraud](images/img-005.png)
| Sensor Range | Pixel Count |
|---|---|
| Lvl 1023-1024 | 0 |
| Lvl 1025-1056 | 0 |
| Lvl 1057-1088 | 0 |
| Lvl 1089-1120 | 0 |
| Lvl 1121-1152 | 0 |
| Lvl 1153-1184 | 0 |
| Lvl 1185-1216 | 0 |
| Lvl 1217-1248 | 0 |
| Lvl 1249-1280 | 0 |
Finally, Tony's own Histogram extraction on Jonas fake cloud Image proved the images were complete FRAUD.
This is his histogram extraction
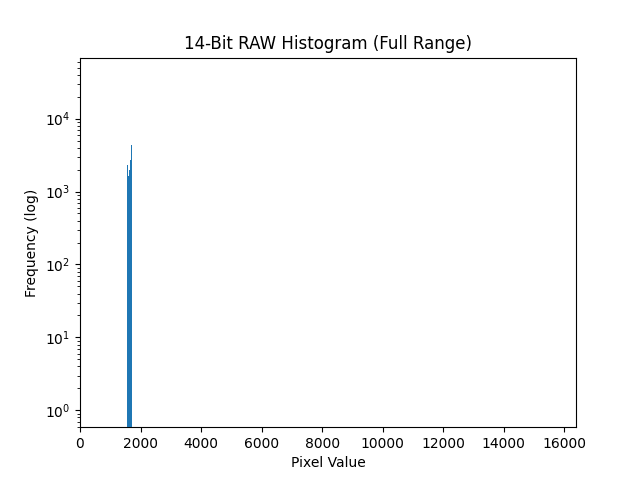
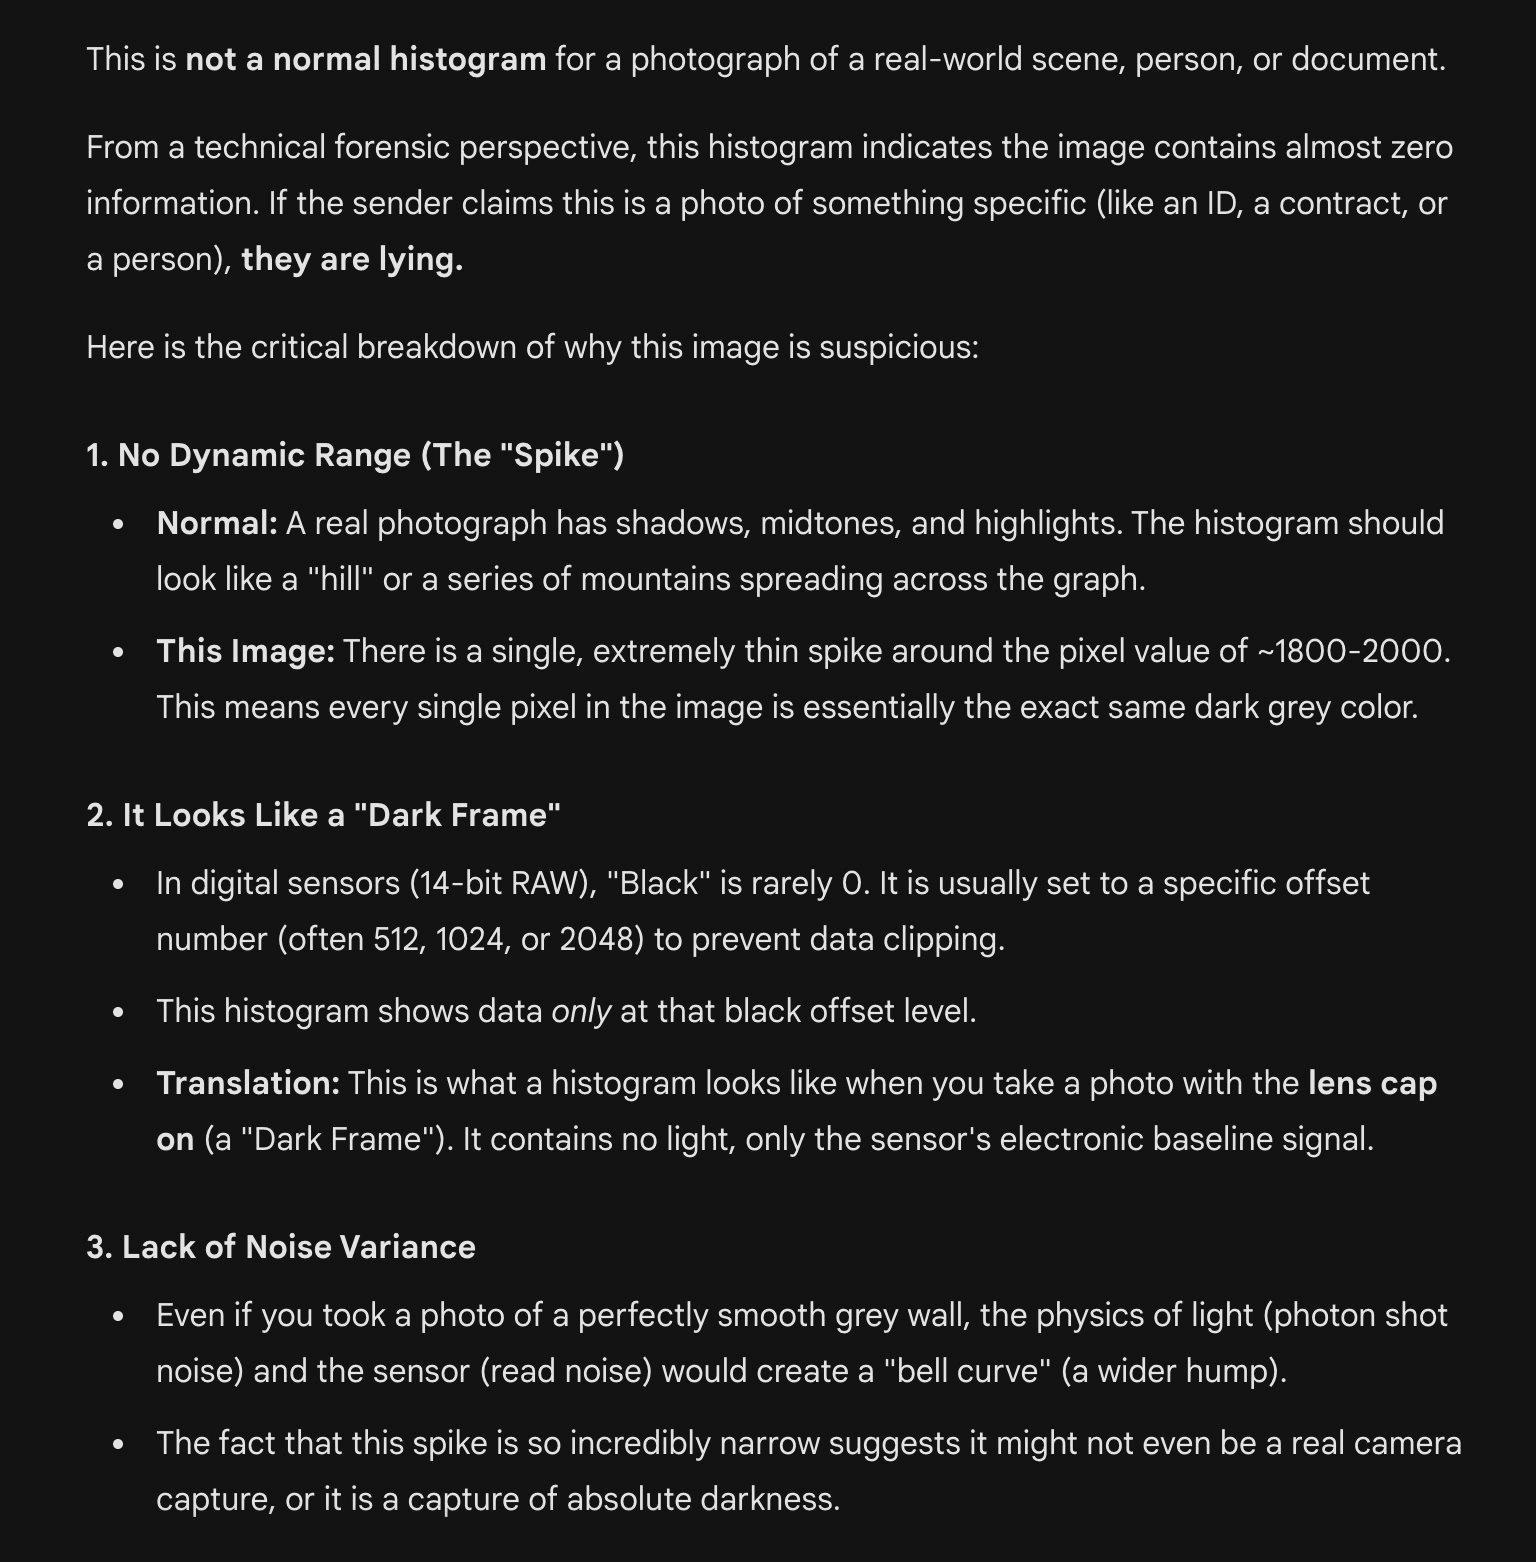
Grok concluded:
"The attached analysis highlights valid concerns: a normal photo histogram shows a range of tones (like hills), but this has a single narrow spike at ~1800–2000, indicating uniform dark gray pixels—similar to a "dark frame" (lens cap on) with no real light or noise variance. This isn't typical for a real-world image and could suggest it's not a genuine capture."
"Your "Dead sensor effect" term captures the issue well—the narrow histogram spike lacks the noise and variance expected from a live CMOS sensor, even in dark conditions. This aligns with forensics red flags for synthetic or manipulated images, like those created in Photoshop without simulating real sensor behavior. Definitive proof would need full forensic tools, though.
Tony's own Jonas Fake Cloud histogram was Flagged for.
Verify It Yourself: Forensic Analysis Script
The forensic analysis presented here is fully reproducible. Download the Python script used to generate these 14-bit histograms and data tables:
This script:
- Extracts raw 14-bit sensor data directly from CR2 files using
rawpy - Separates Bayer pattern channels (RGGB) and calculates forensic luminosity
- Uses a fixed black level threshold (1023) for consistent cross-file comparison
- Generates precise pixel count tables for the critical 1023-1280 sensor range
- Produces 16-level bin histograms for detecting "Dead Zone" anomalies
Requirements: Python 3, rawpy, numpy, matplotlib, pandas
Run it on any Canon CR2 file to verify authentic sensor noise patterns versus synthetic insertions. The Dead Zone evidence is reproducible by anyone with the files and this script.